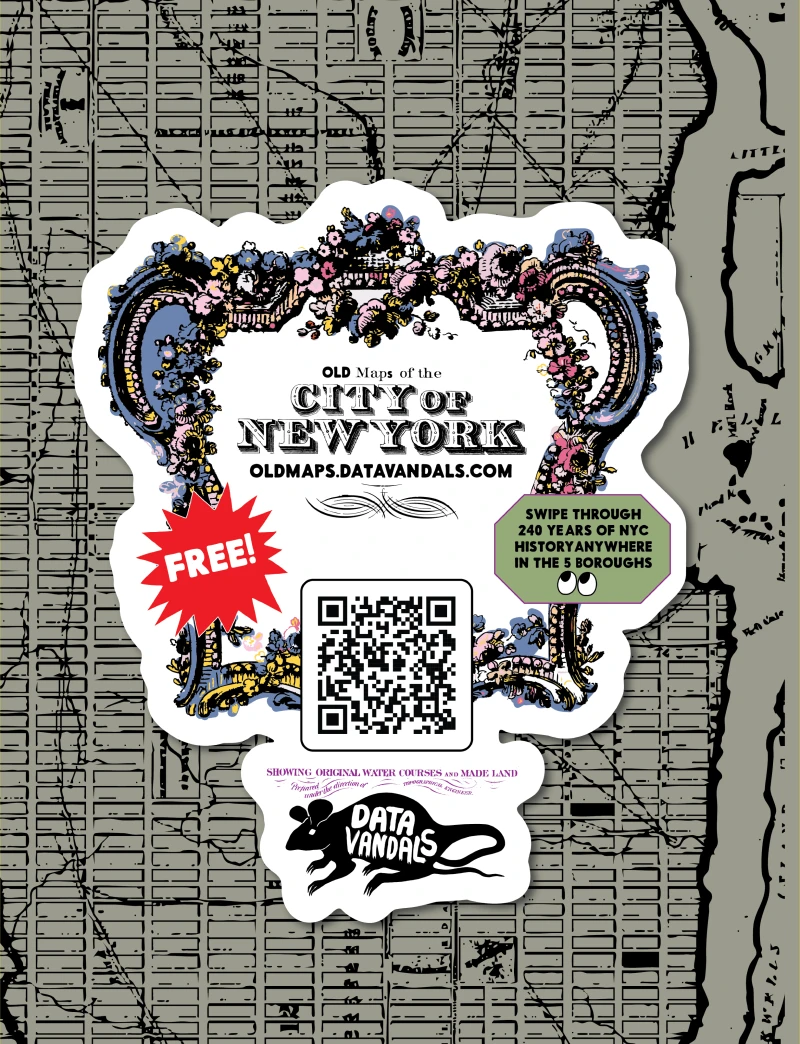
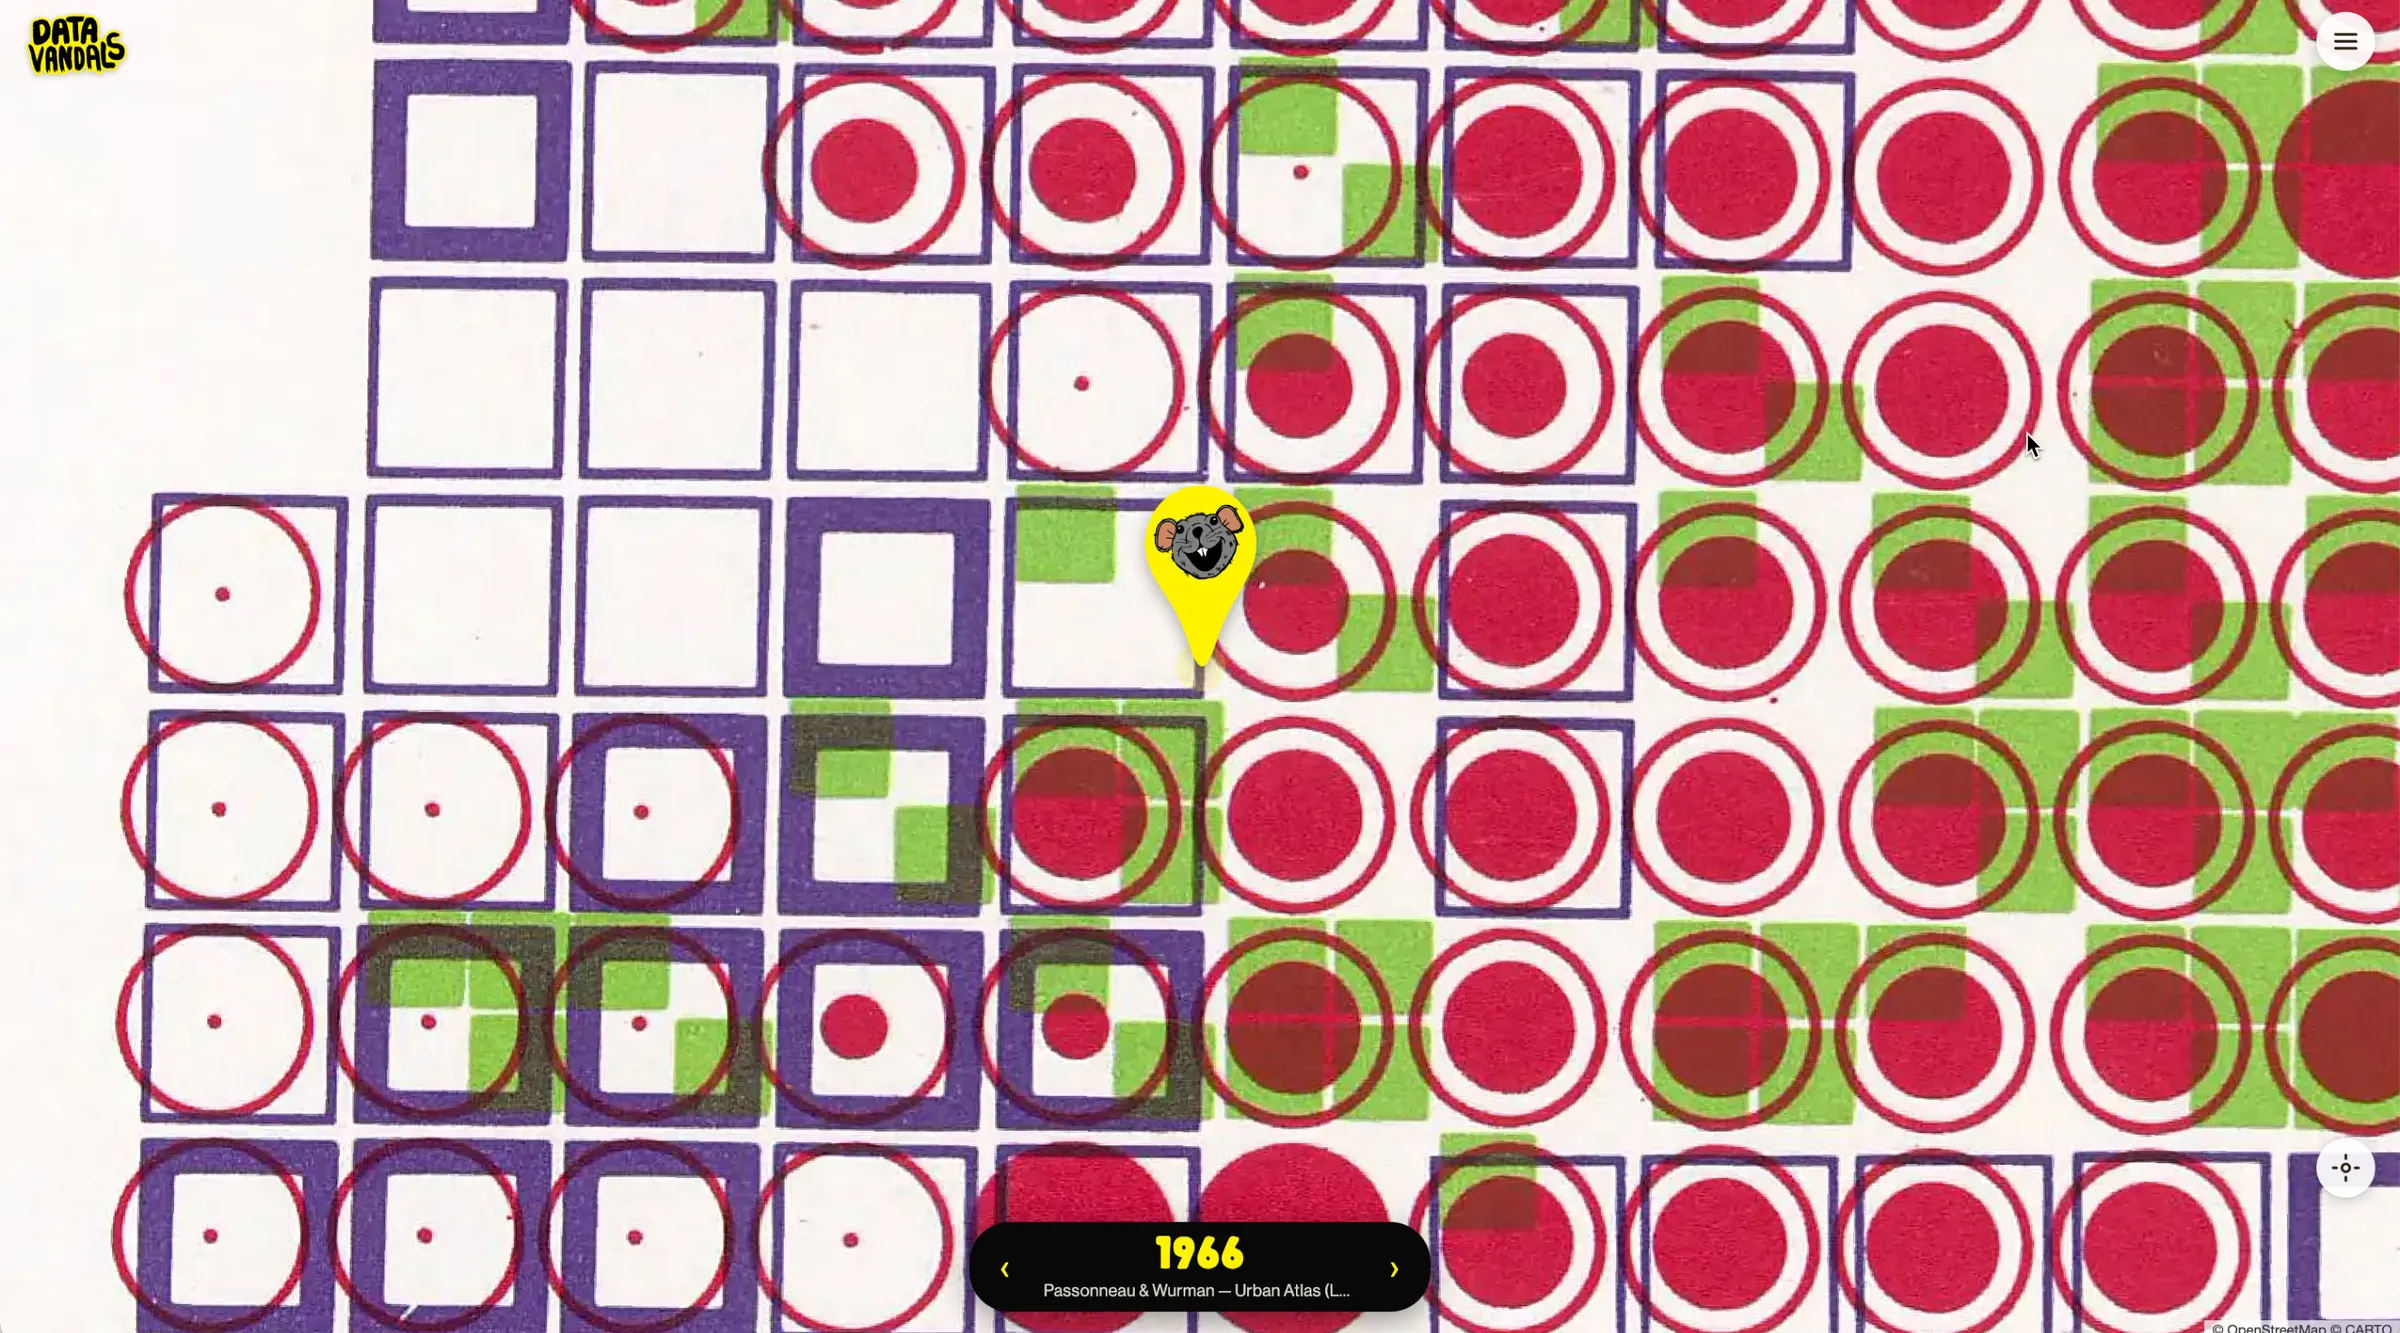
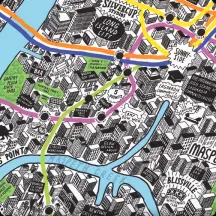
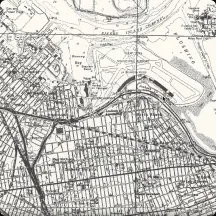
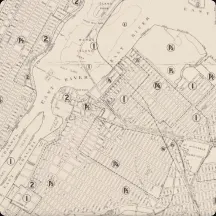
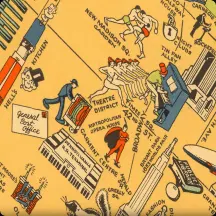
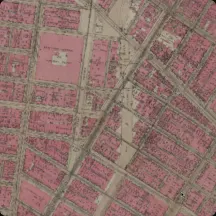
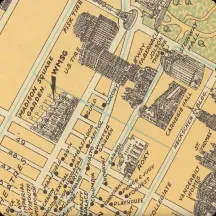
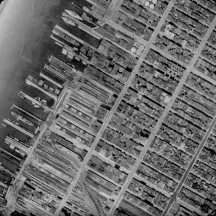
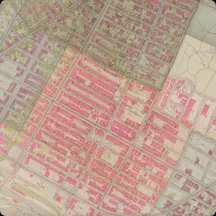
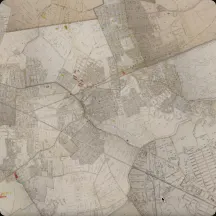
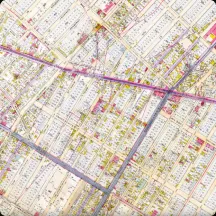
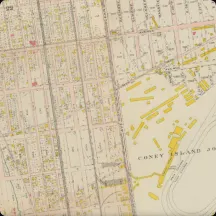
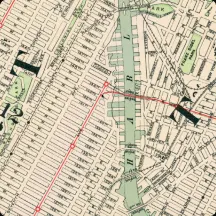
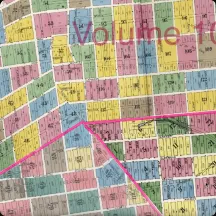
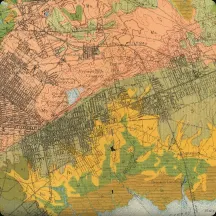
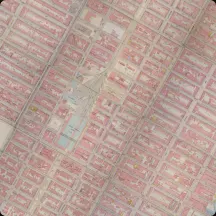
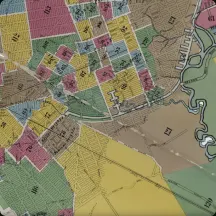
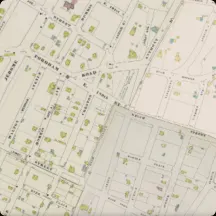
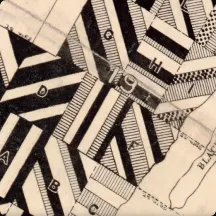
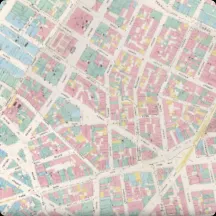
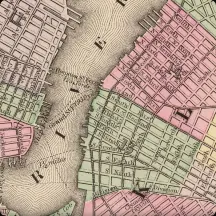
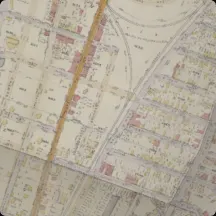
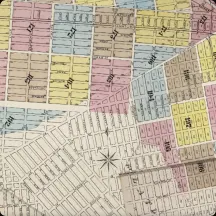
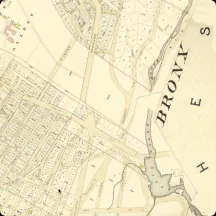
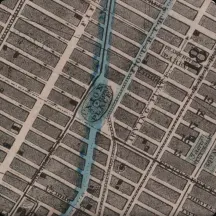
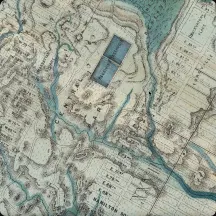
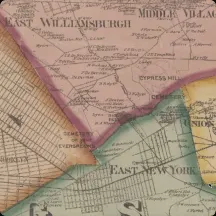
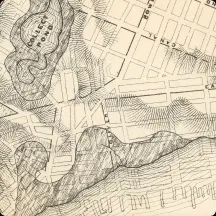
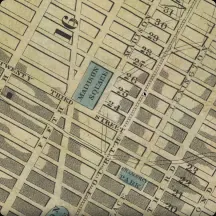
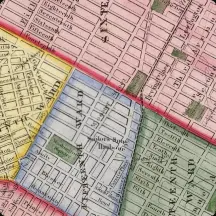
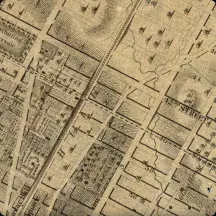
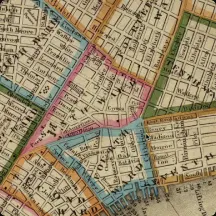
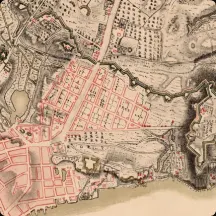
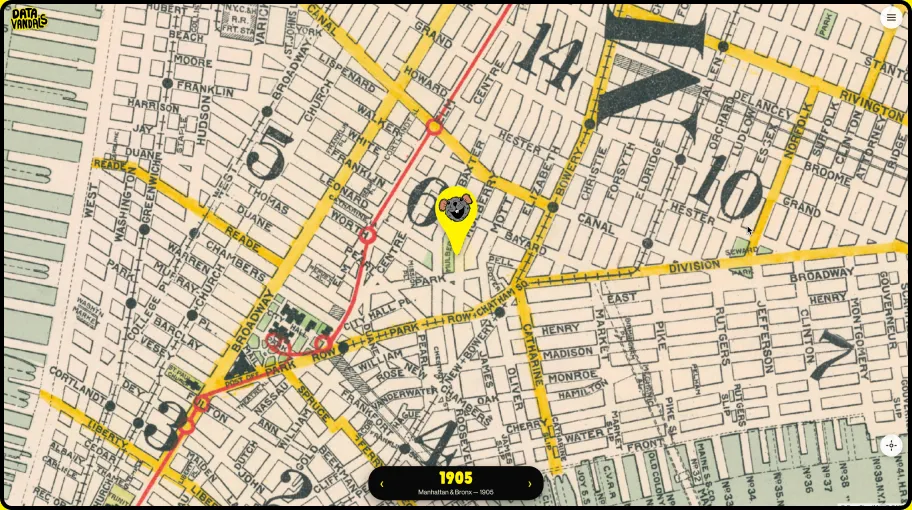
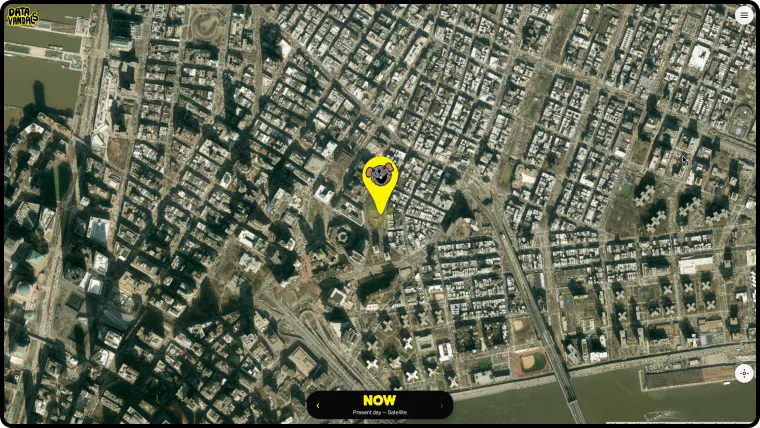
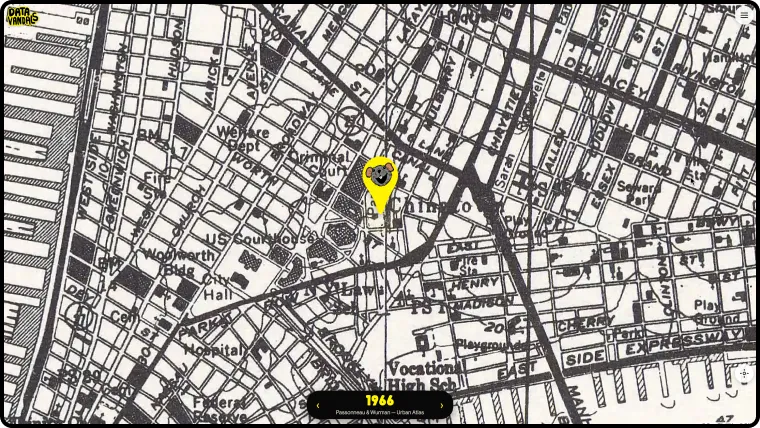
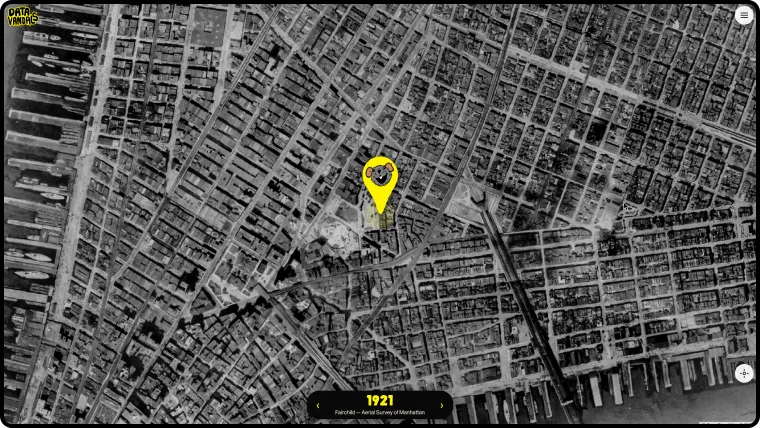
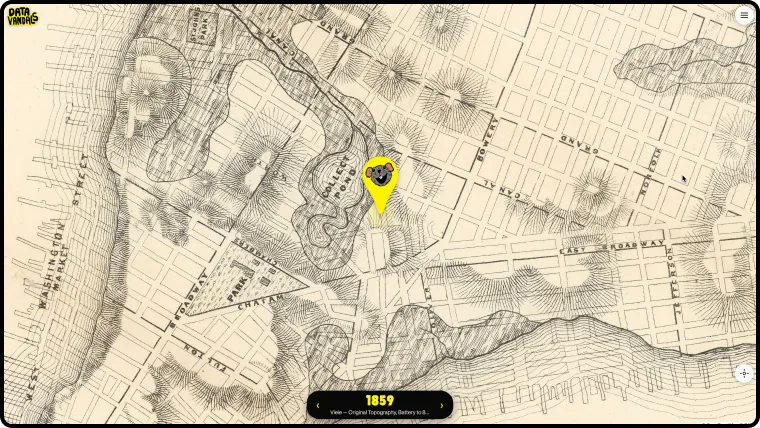
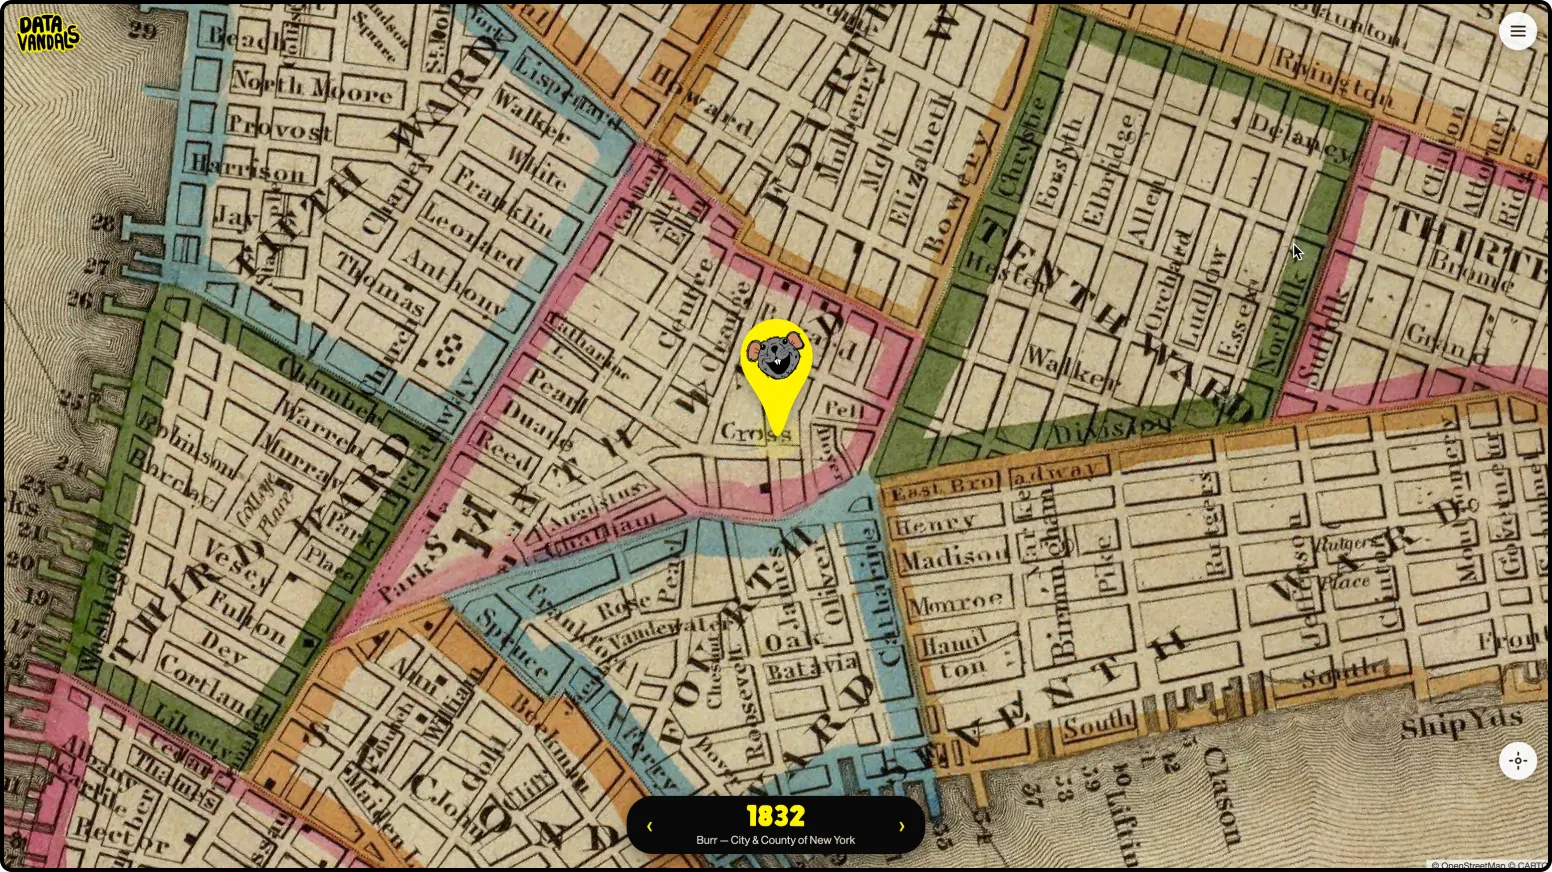
Old Maps on a laptop, mid-swipe: a 1966 layer, with the rat pin on where you are standing.
01 · The idea
Don’t move through the city. Stand still and move through time.
Historical map archives are magnificent and almost unusable — you arrive at a scan of a place you have to identify yourself, at a scale you have to guess. The premise here inverts that: the app asks where you are, centres every map on that point, and lets you swipe backwards through the years like a stack of tracing paper.
The result is that a street corner becomes the unit of exploration. You are not looking up Manhattan in 1782 — you are looking up your own doorstep in 1782, and the marsh that used to be under it.
Made by
Data Vandals (Jen Ray and Jason Forrest)
Year
2026
Format
Mobile web app — installable, with an offline kiosk mode
historical maps, georeferenced and stacked in order
238
years covered, from 1782 to the 2020 census
5
boroughs — it works anywhere in the city
0
accounts, logins or onboarding — it opens on your block
02 · The archive
Thirty-six maps, in order, oldest first.
War Office manuscripts, insurance atlases, soil surveys, aerial photographs, zoning books, a pictorial tourist map and a census — each one scanned, georeferenced, and warped onto the same globe so they can be compared without leaving the spot you are standing on.
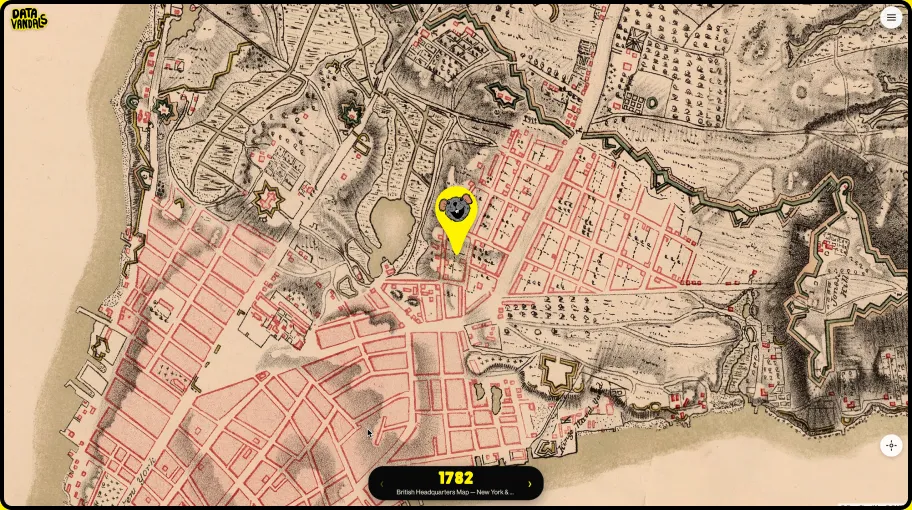
1782
British Headquarters Map
The most detailed surviving map of Revolutionary-War Manhattan, with its marshes, farms and fortifications. Gt. Britain War Office / B. F. Stevens.
1865
Viele — Topographical Map
The buried-water map. Every stream and salt meadow the city was built on top of, and still floods over.
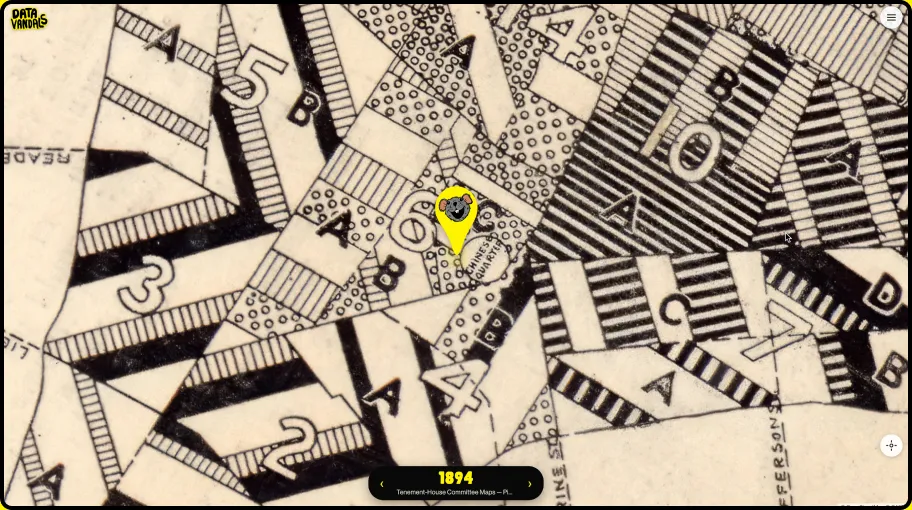
1894
Tenement-House Committee
Pierce’s maps of how densely the Lower East Side was actually living — reform-era data journalism.
2020
Race & Ethnicity
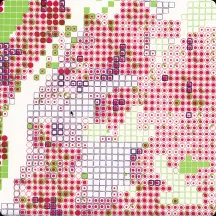
The census as a dot map: one dot per ten people, placed at random inside each block. The only layer that is not a picture.
Every map in the app
03 · The exploration
Three gestures, no instructions.
LOCATE
It opens on you.
The app asks for your location once and centres every layer there. Drag to wander; tap the crosshair and it snaps back to where you actually are.
SWIPE
Left and right is time.
The scrubber runs oldest-first. Each step redraws the same square of ground under a different century’s hand — a manuscript, then an atlas, then an aerial photograph.
SHARE
Every view is unique.
Any position and year makes a shareable frame, so the thing people post is their own corner rather than a screenshot of the app.
04 · In your pocket
Built for a phone on a street corner.
Every map has an info card with its source and context, and a slider that fades it over today’s streets.
Search any address in the five boroughs, or jump to a featured spot that changed the most.
One tap makes a branded postcard of your view — or a link that opens the exact map and spot for someone else.
Install it on your home screen like an app; kiosk mode downloads your neighbourhood and runs offline.
Made as fast as possible, because phone service in the city can be dodgy.
“Coverage is best in Manhattan and the older cores of the boroughs.”
Written on the app itself. Saying where a dataset thins out, in the product rather than in a footnote, is the same instinct as the certainty flags on the Ray archive — and it is the through-line in how this studio treats an audience.
Historical maps
Georeferenced scans via the David Rumsey Map Collection, the Library of Congress, Map Warper and OldMapsOnline.