
Shaping how business sees data
We make datarelatable, intuitive,and human.
We turn data into tools, stories, and experiences.


What we do
Tools for better, faster decisions
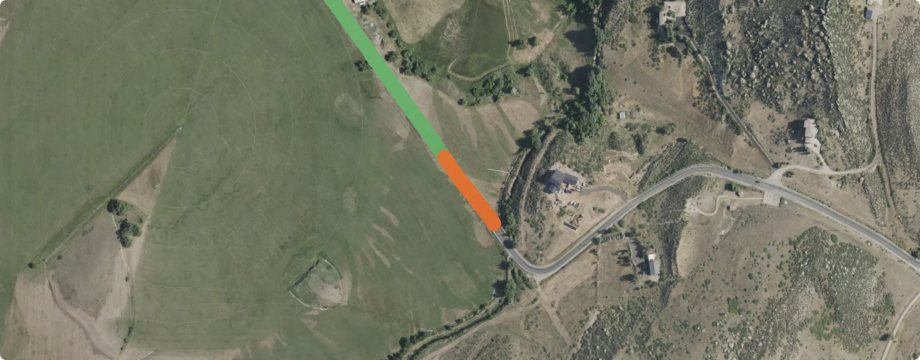
Exploratory interfaces, digital twins, dashboards and bespoke software that let a team interrogate their data instead of being shown a conclusion.
Stories that create understanding
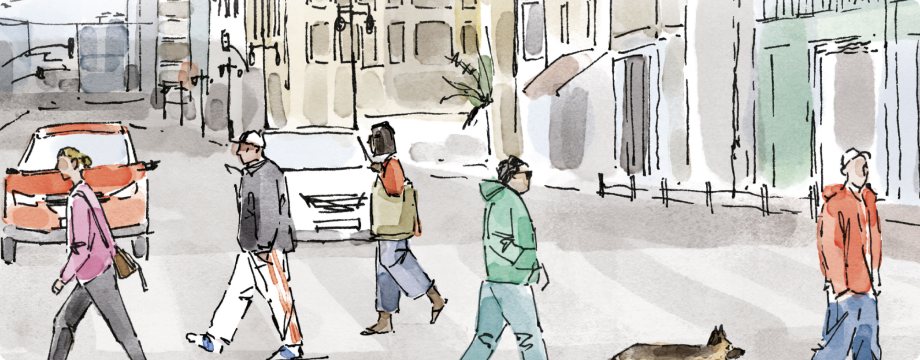
Editorial design, reports, films and campaigns that move an audience from “I saw the number” to “I understand what it means and what it costs.”
Experiences people don’t forget
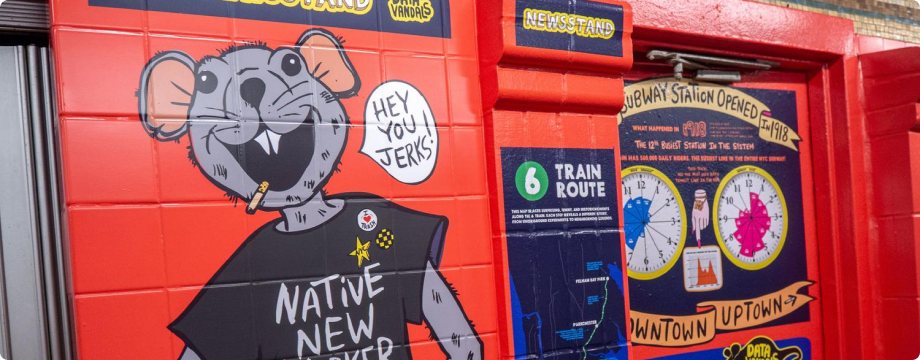
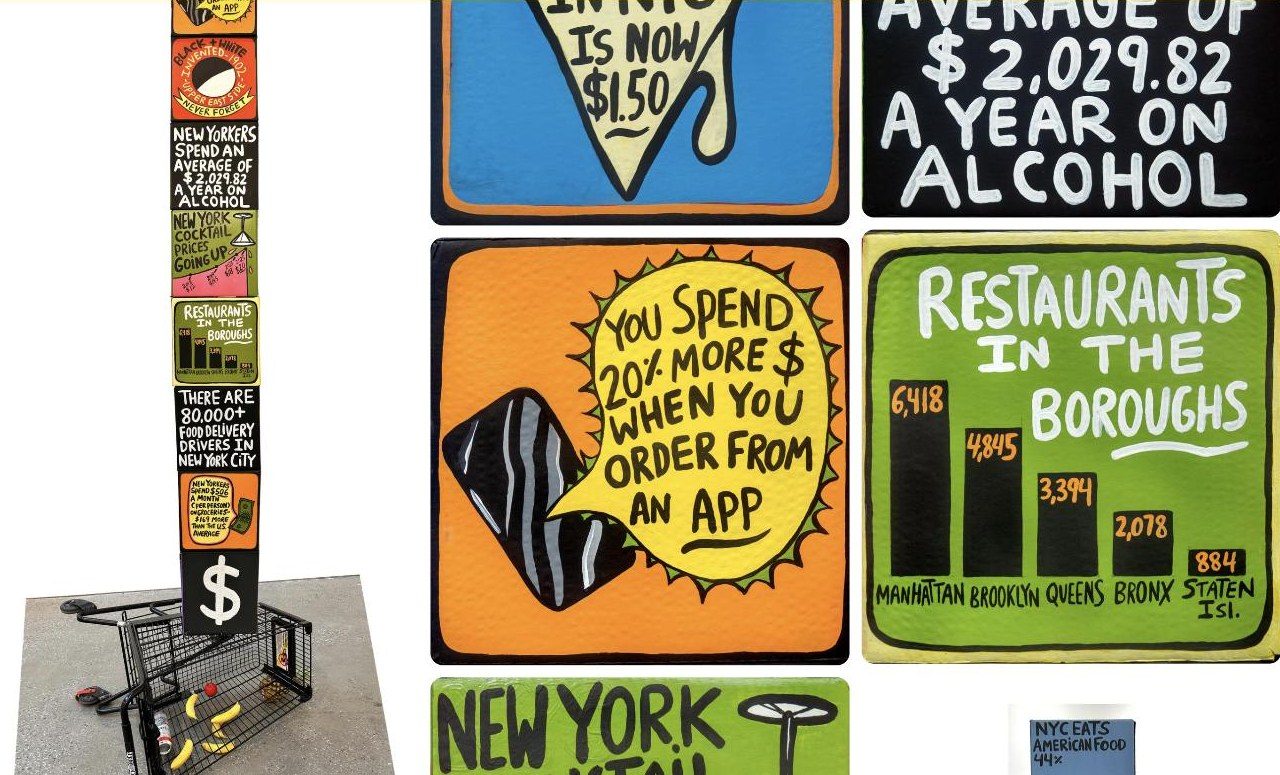
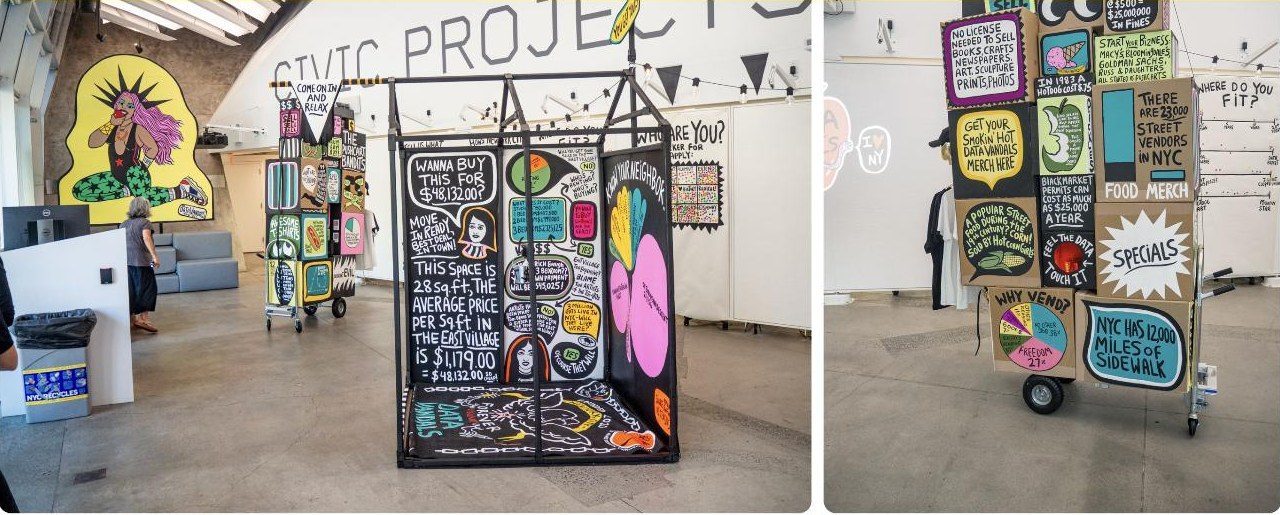
Sculptures, installations and participatory work in physical space — the format that makes a statistic impossible to scroll past.
Data in action
Our work
Self-initiated with Jen Ray · 2026
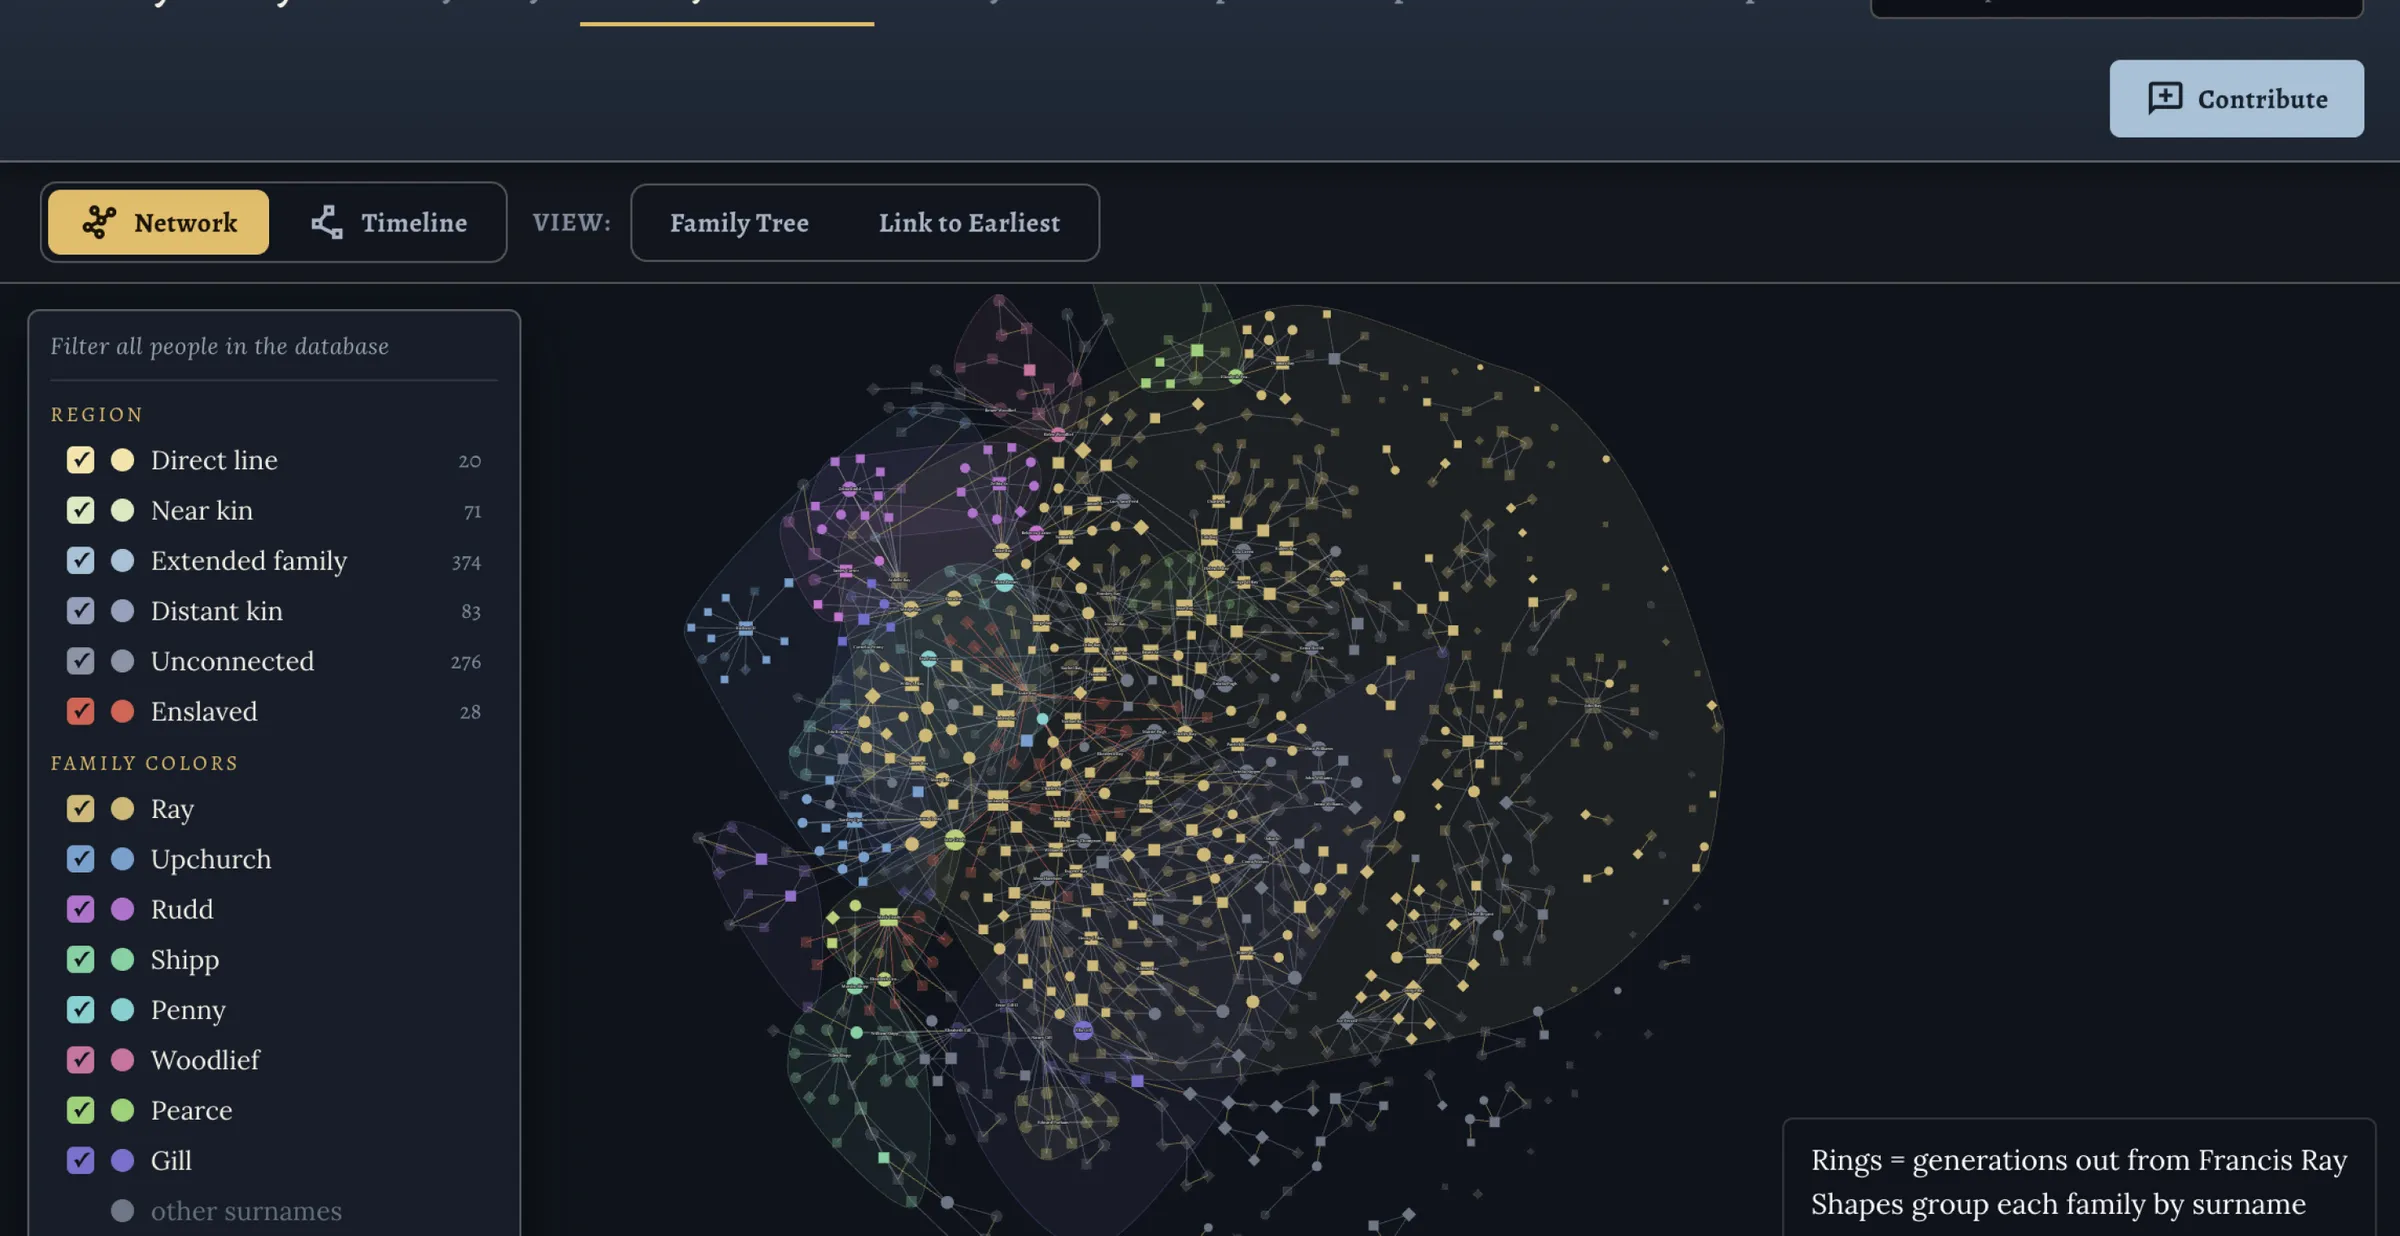
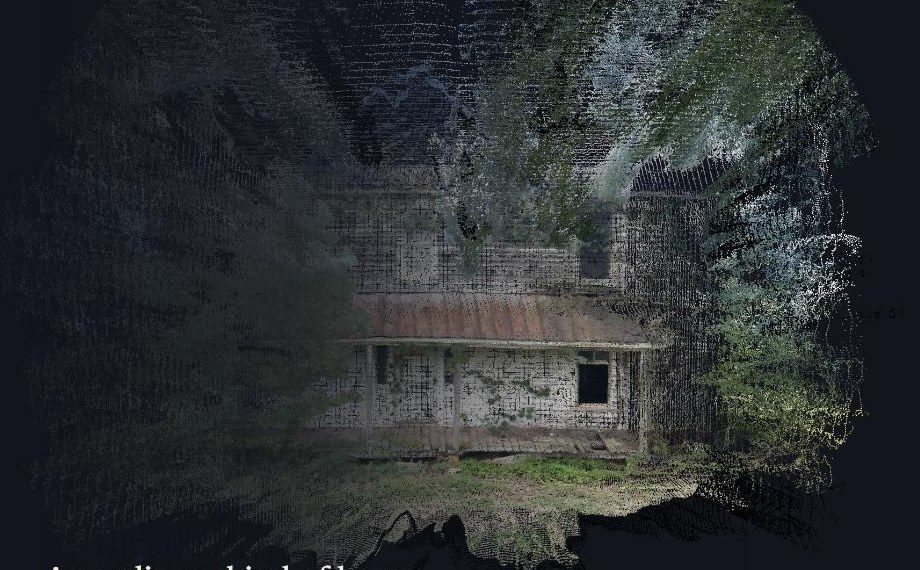
The Ray Family Story
A thousand pages of one man’s handwritten research, turned into a graph — and from that graph, a 326-year history that can be read, searched, and walked through.
- 4,305
- pages of source
- 784
- people in the graph
- 1,826
- relationships
Data Vandals × Mayor’s Office of Los Angeles · 2026
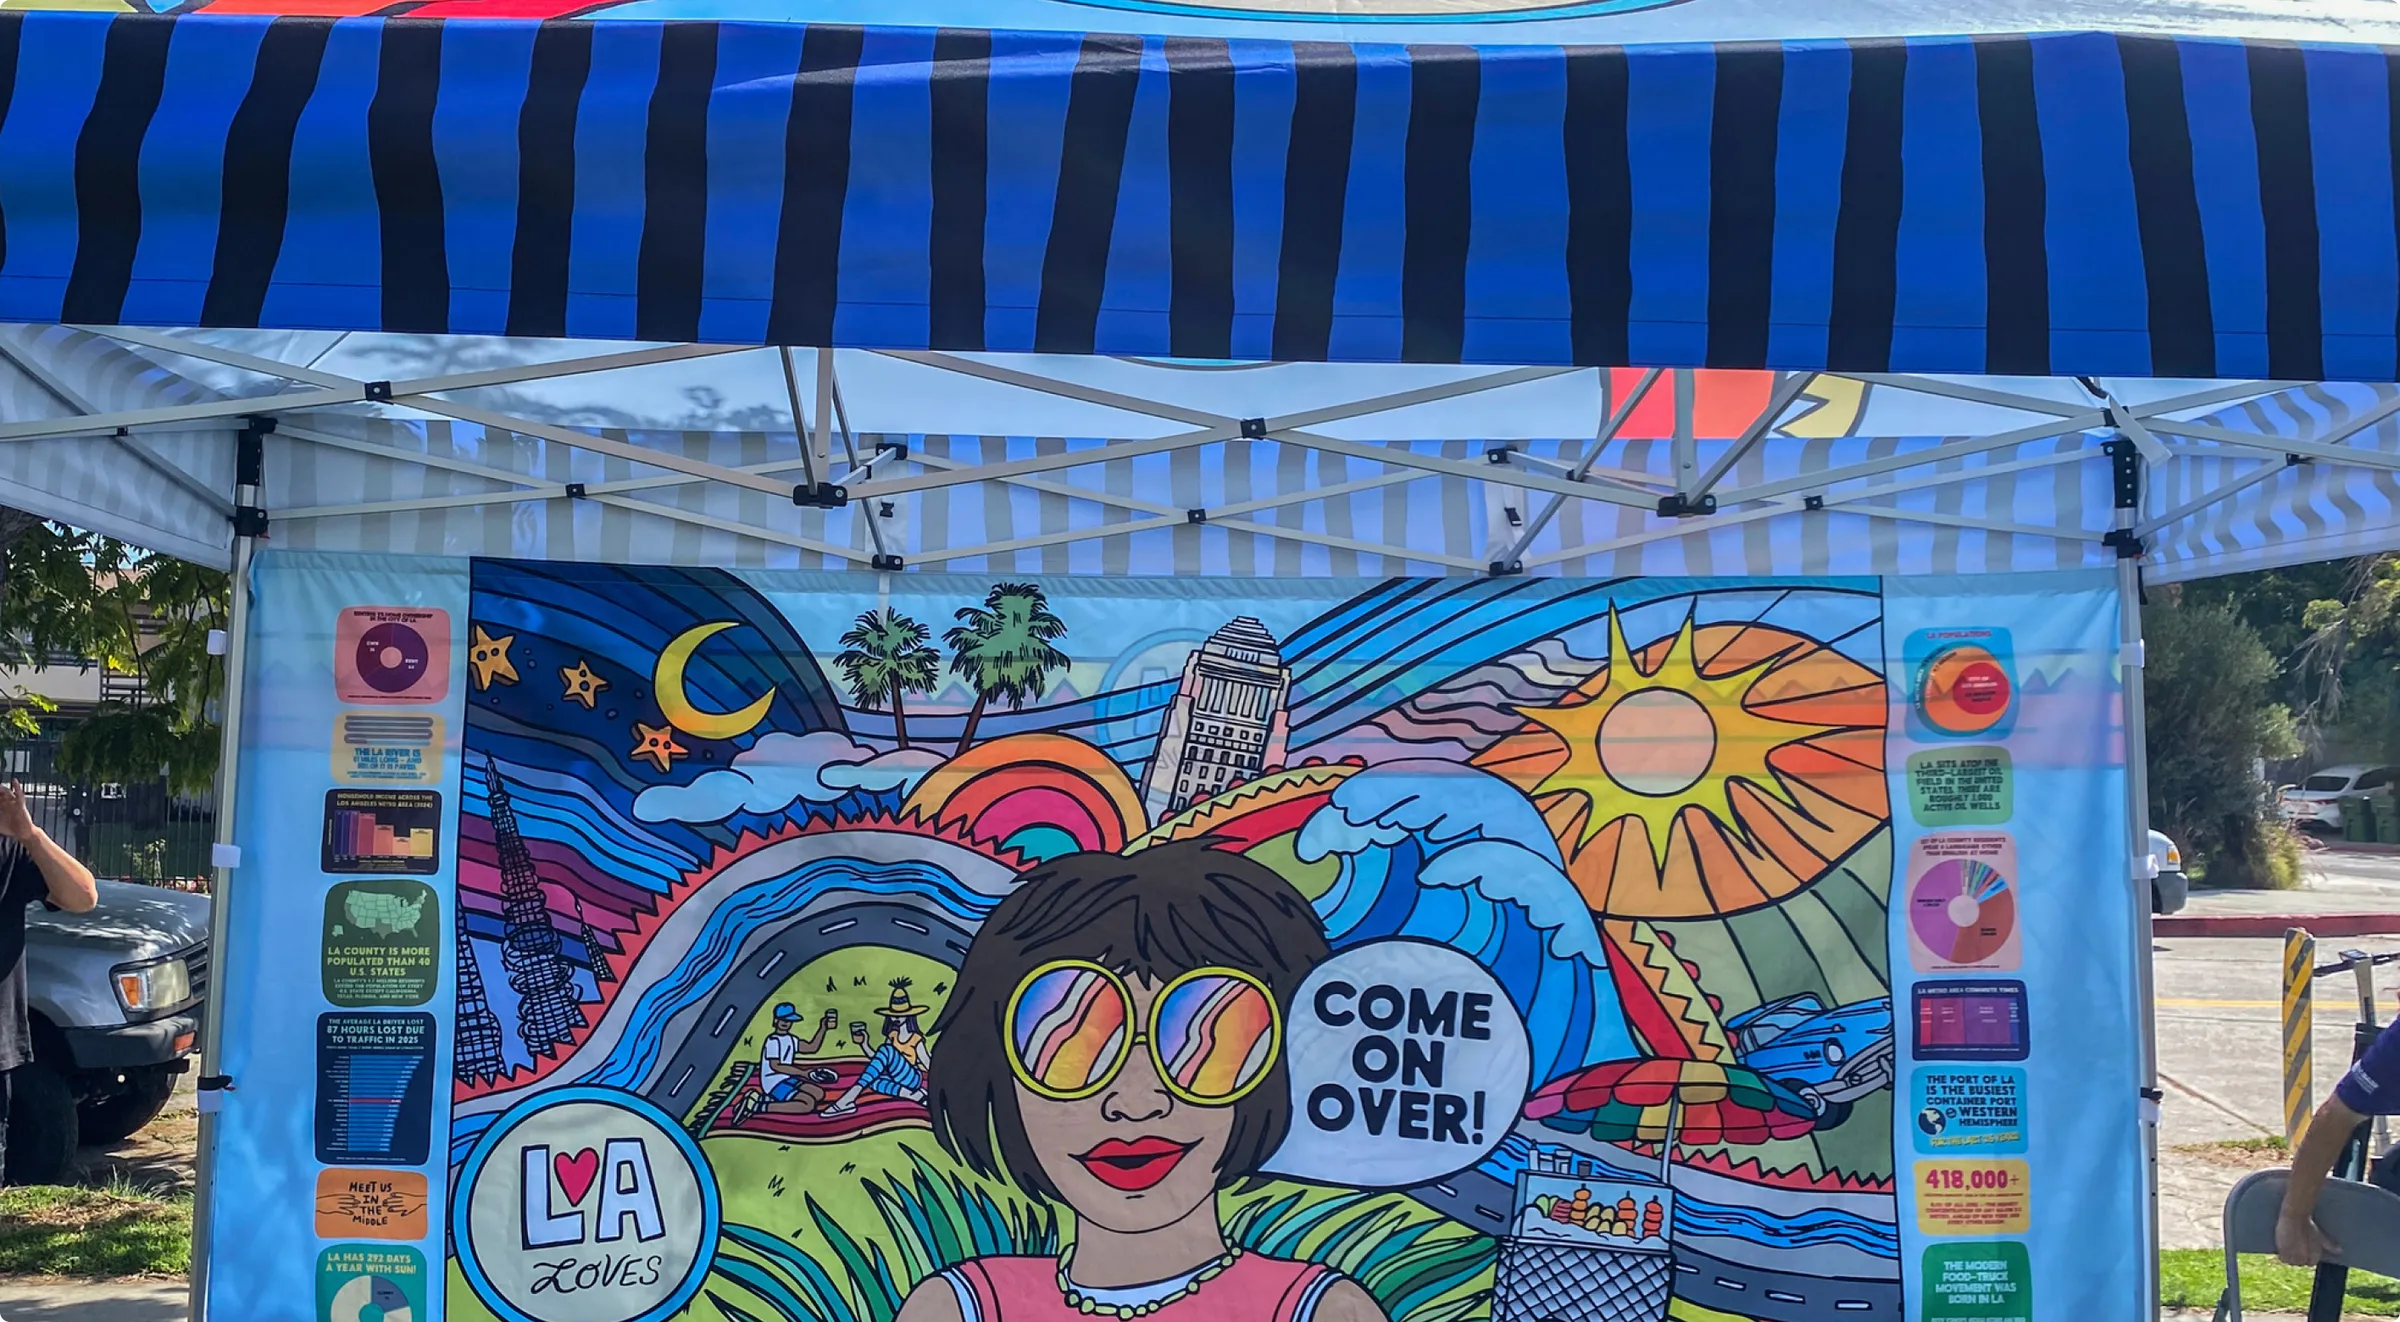
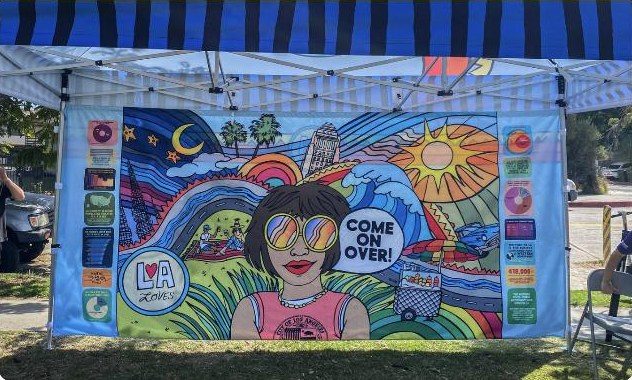
LA Loves
One question for Angelenos at the city’s free World Cup watch parties: what do you love about LA? A tent, a mural and a four-part sticker survey — and the start of a new public dataset.
- 2,700+
- sticker votes
- 76
- written comments
- 5
- parks in ten days
A Data Vandals field trip · 2026
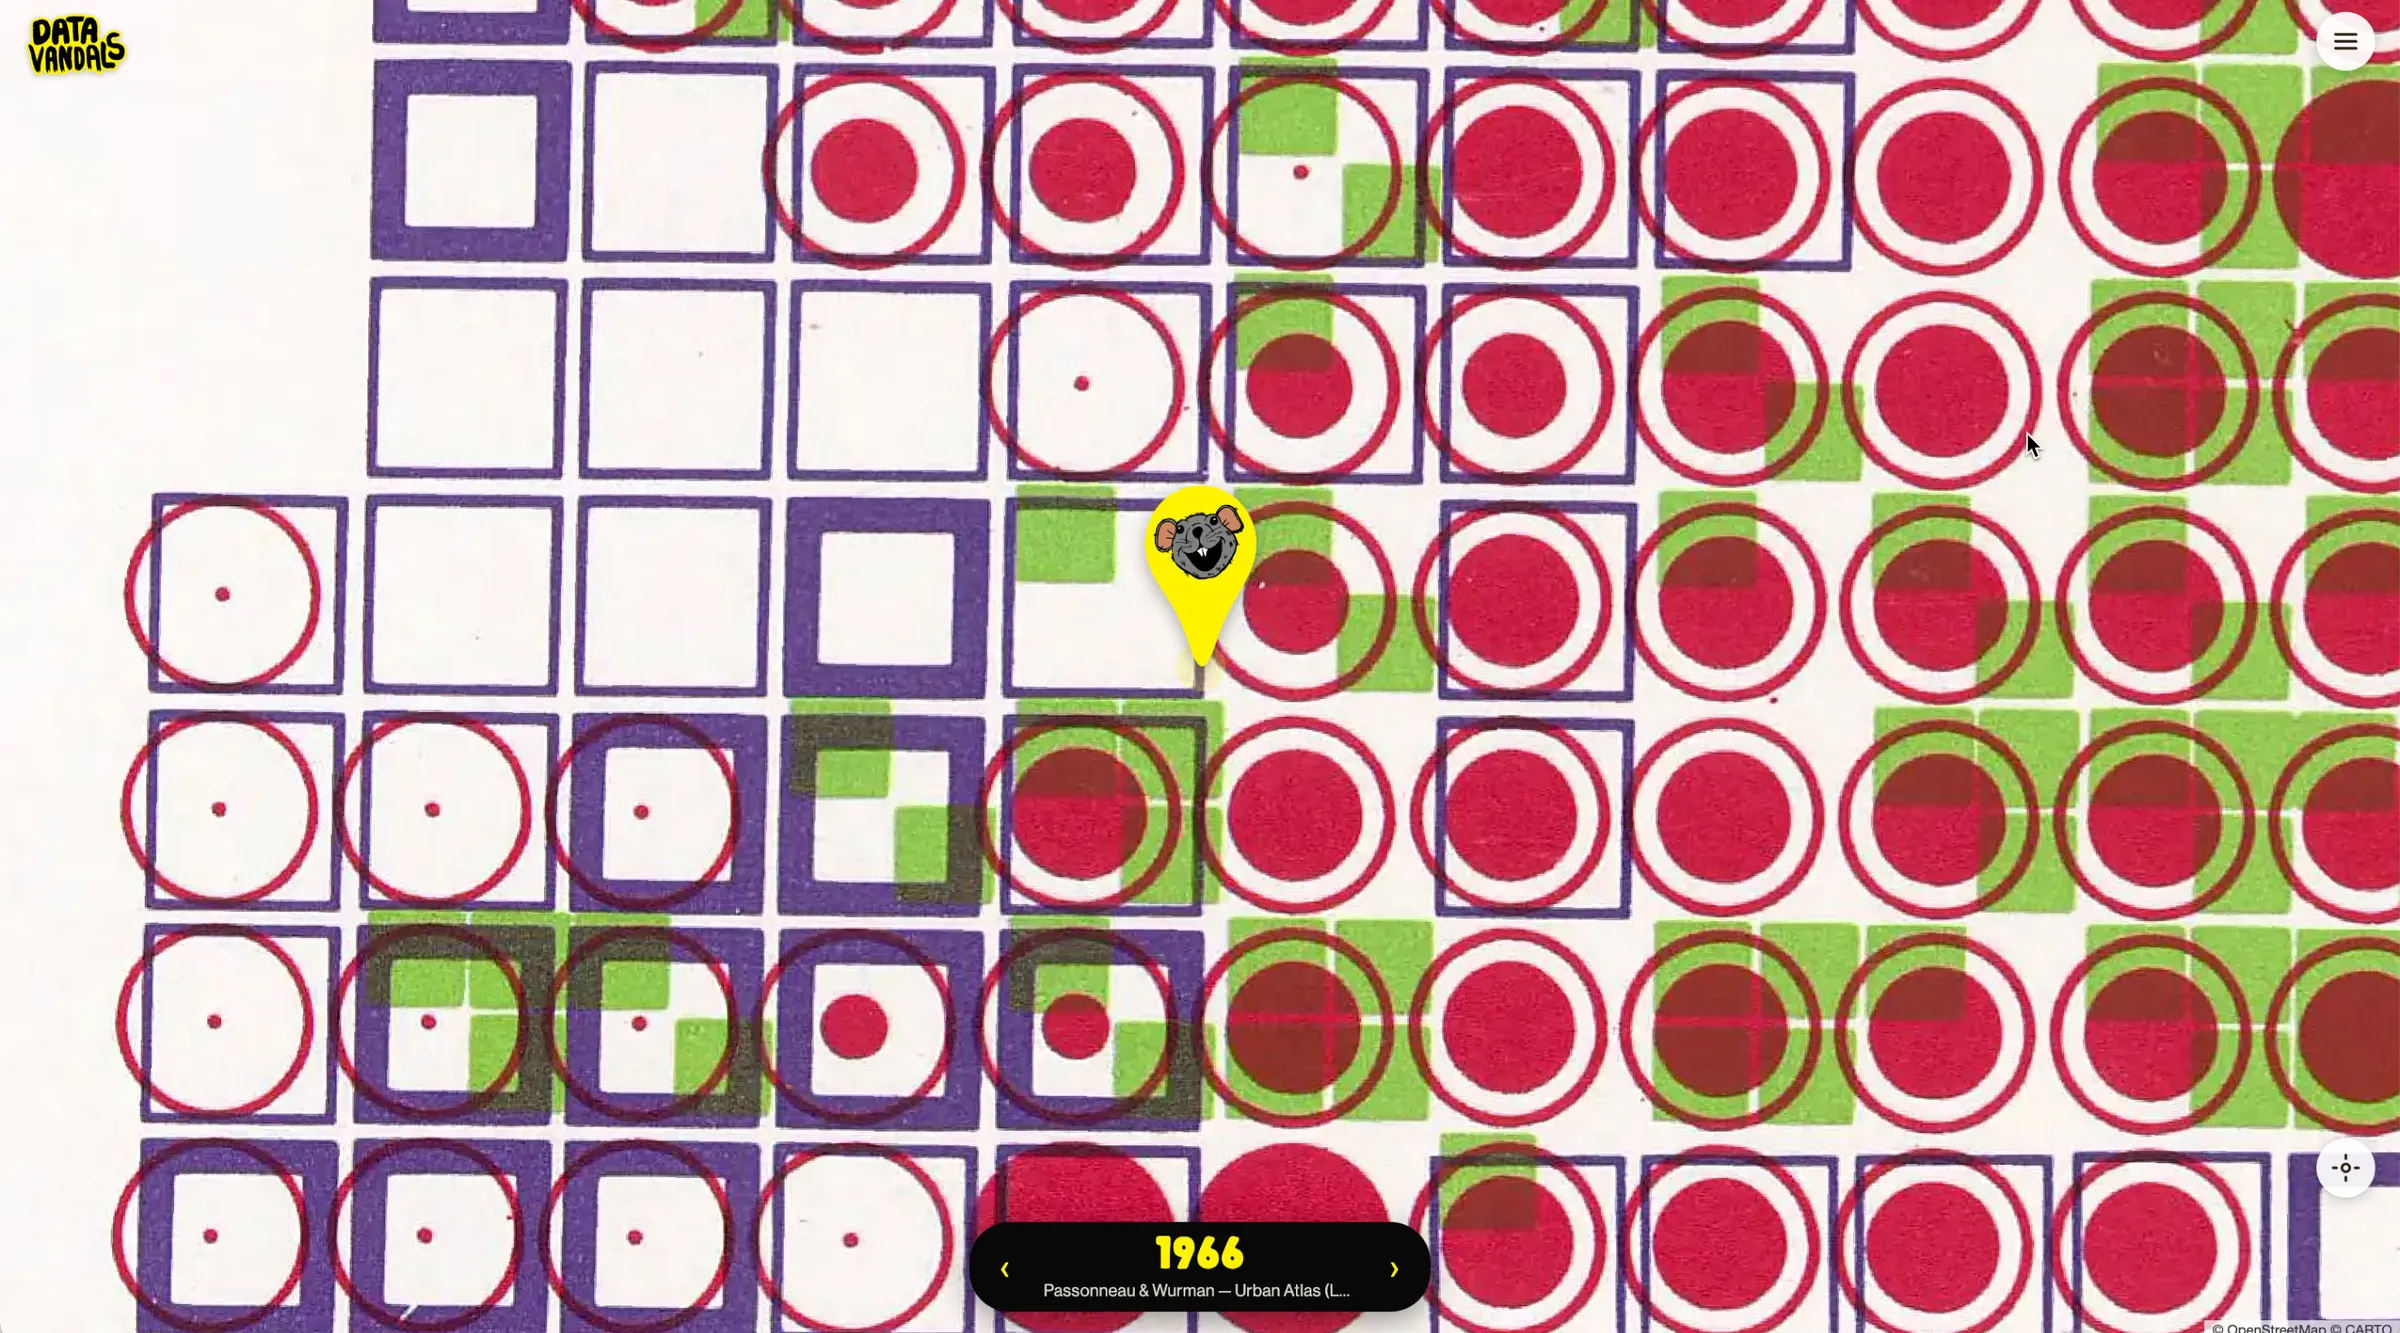
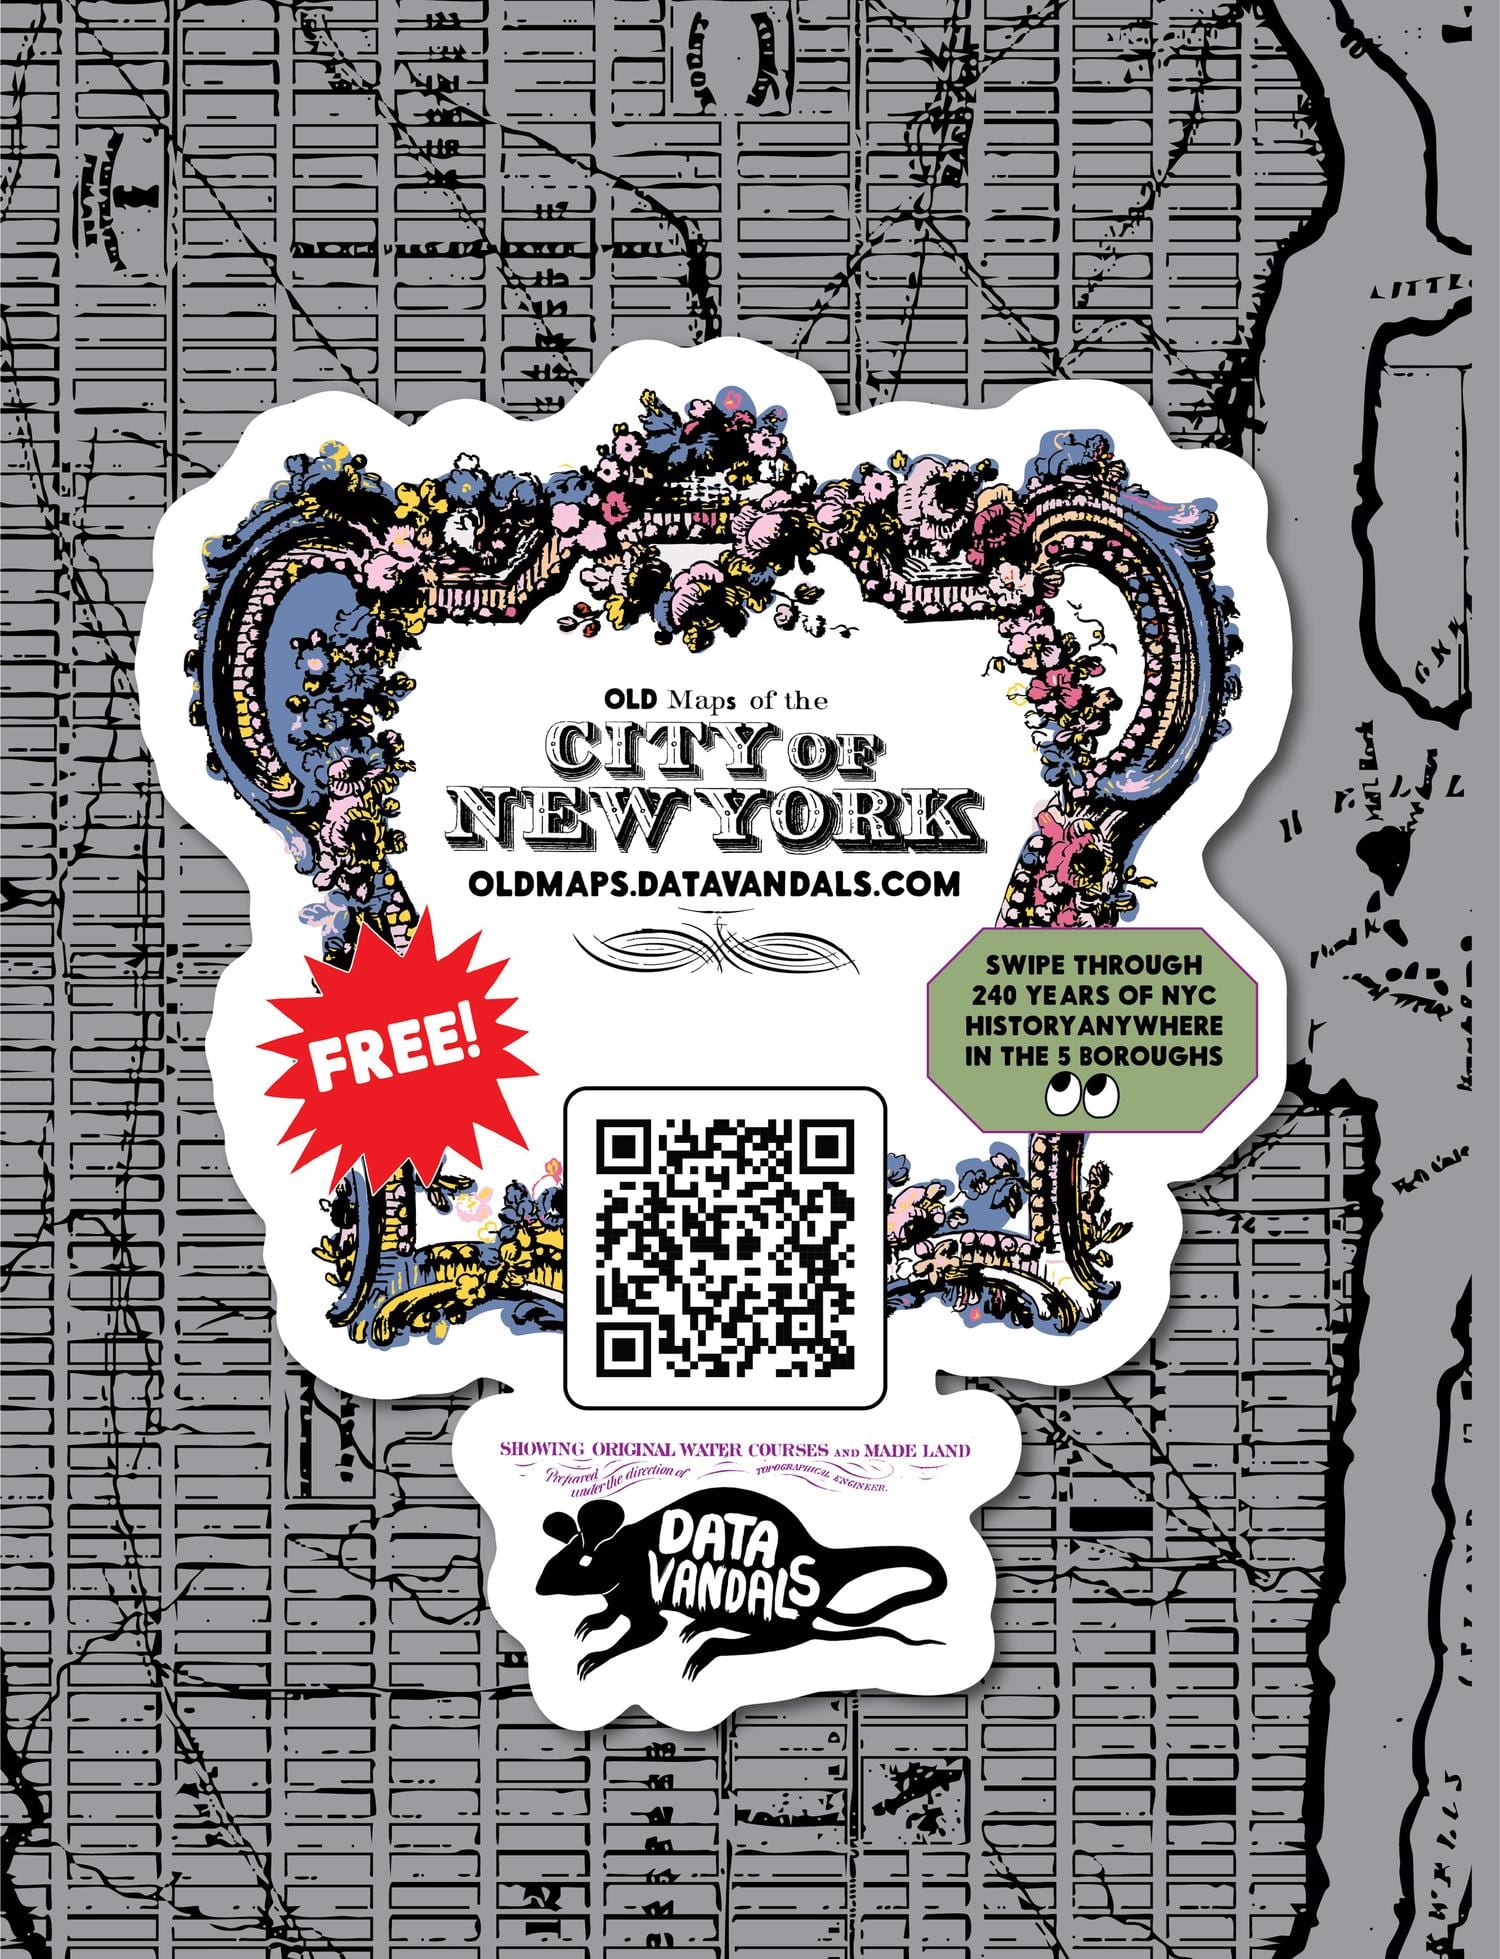
Old Maps of NYC
Stand anywhere in New York City and swipe through 238 years of it. Thirty-six historical maps, pinned to the spot where you are actually standing.
- 36
- georeferenced maps
- 238
- years of New York
- 0
- accounts to make
Crankstart · San Francisco · 2025
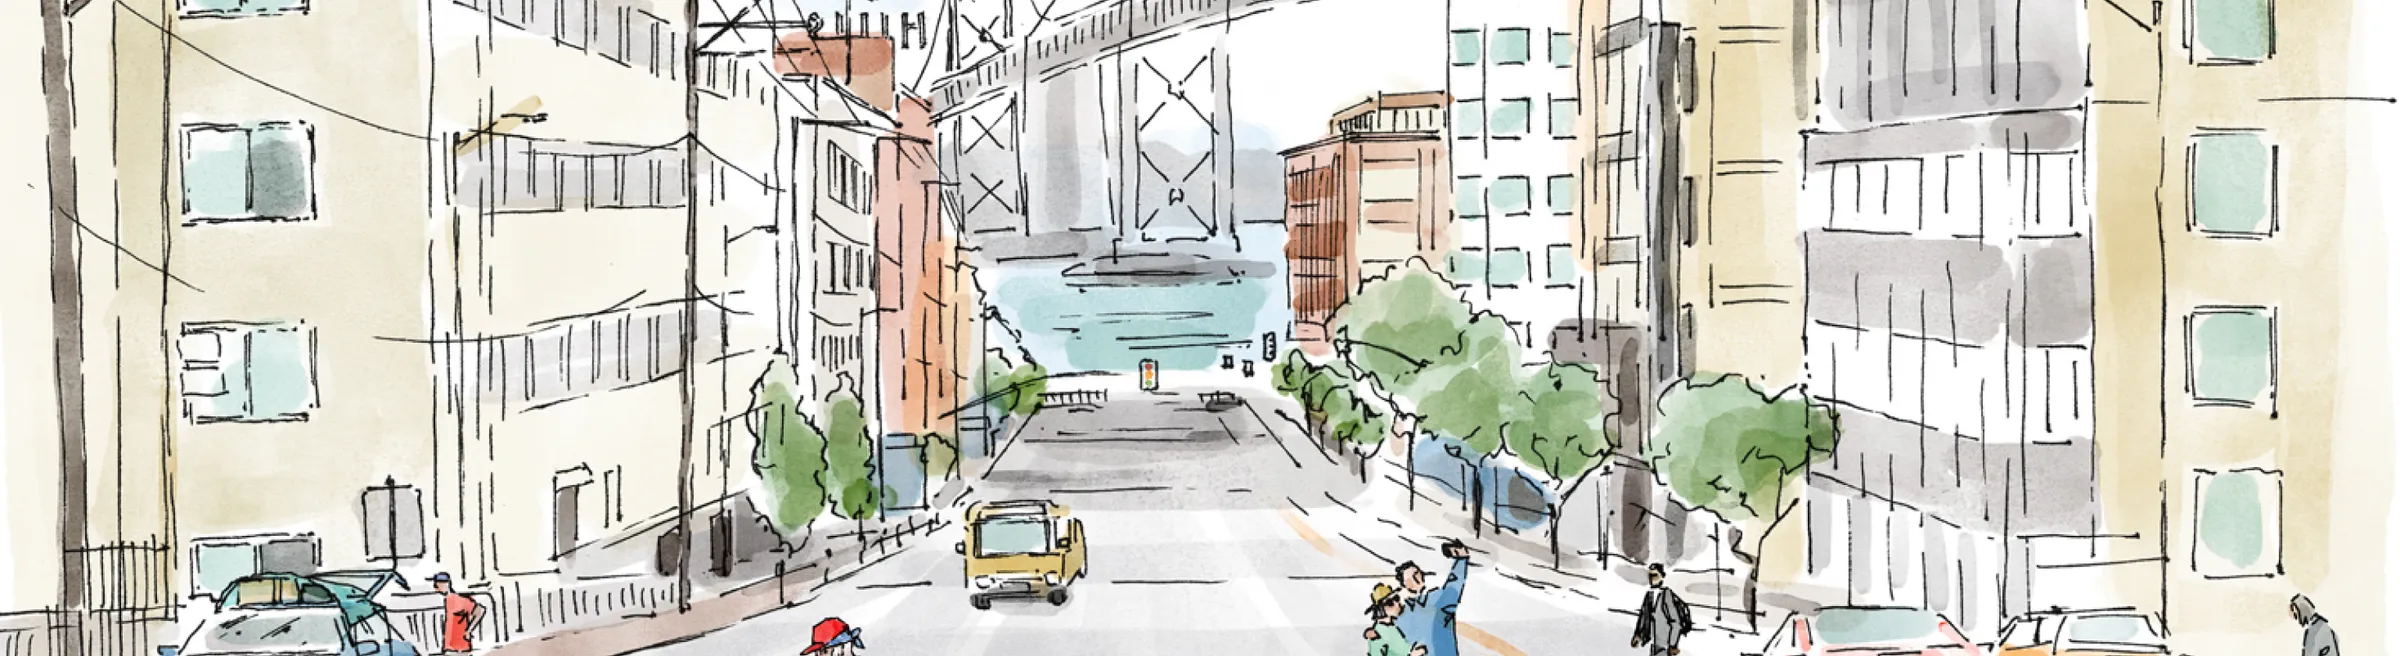
Streets to Stability
Twelve recommendations to make homelessness rare, brief and non-recurring — and an interactive report that lets a policymaker see the system they are trying to fix.
- 8,300
- people unsheltered on a given night
- 232
- service providers mapped
- 12
- recommendations
The work we can’t put on a website
Our largest engagements are under NDA. Ask, and we’ll walk you through them.
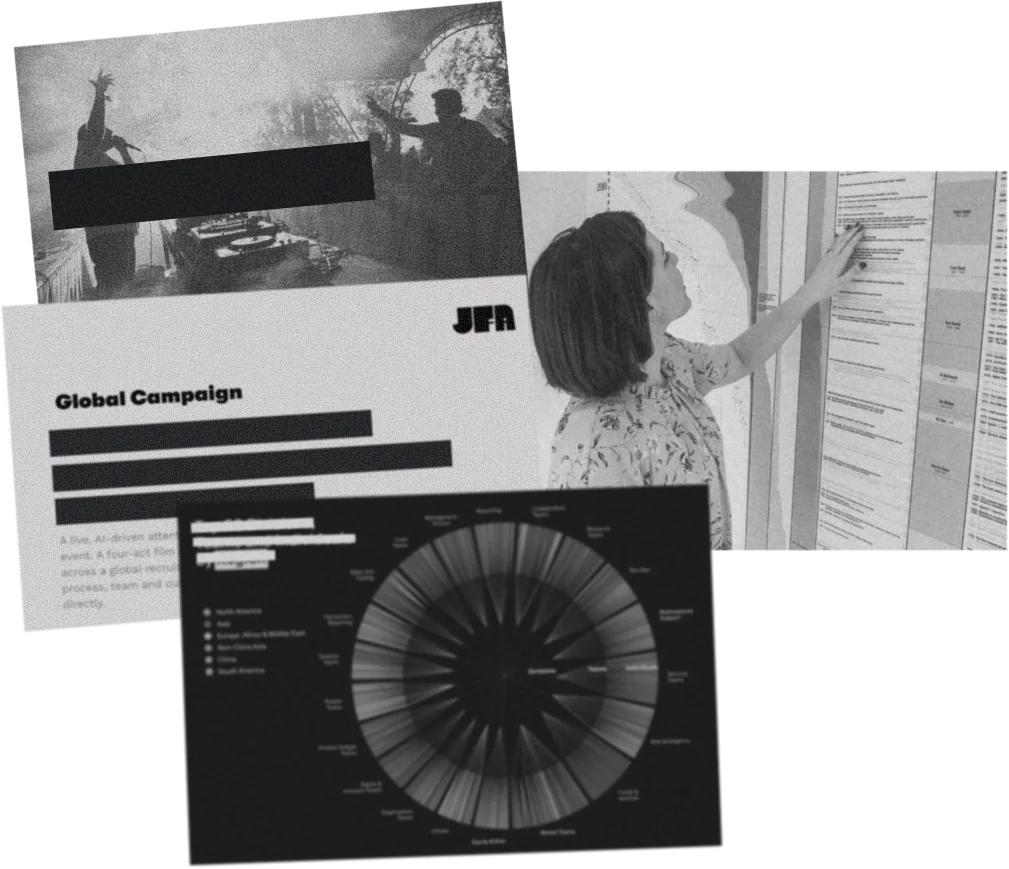
A live, AI-driven attention tool built for a worldwide televised event. A four-act film explaining an AI methodology, deployed across a global recruitment campaign. The private deck covers process, team and outcomes — and it comes from Jason directly.
One reply, from a person. No list, no newsletter, no drip.
Our values
Core values

Have fun!
We are passionate about our work and we want to bring as much joy into it as possible.
Quality work is a team sport that follows the process.
Taking the time to make
Great work creates a bigger impact
(more interest, traffic, and opportunities.)
Constraints should be embraced
and fuel the problem-solving process!
Start every project with a conversation
to define your communications objectives, then move to paper and pencil.
We lift people up with everything we do
Creating a positive, supportive environment should be reflected in the way we work as well as our output.
The data is a stakeholder
explore and prototype your data before you commit to design and story
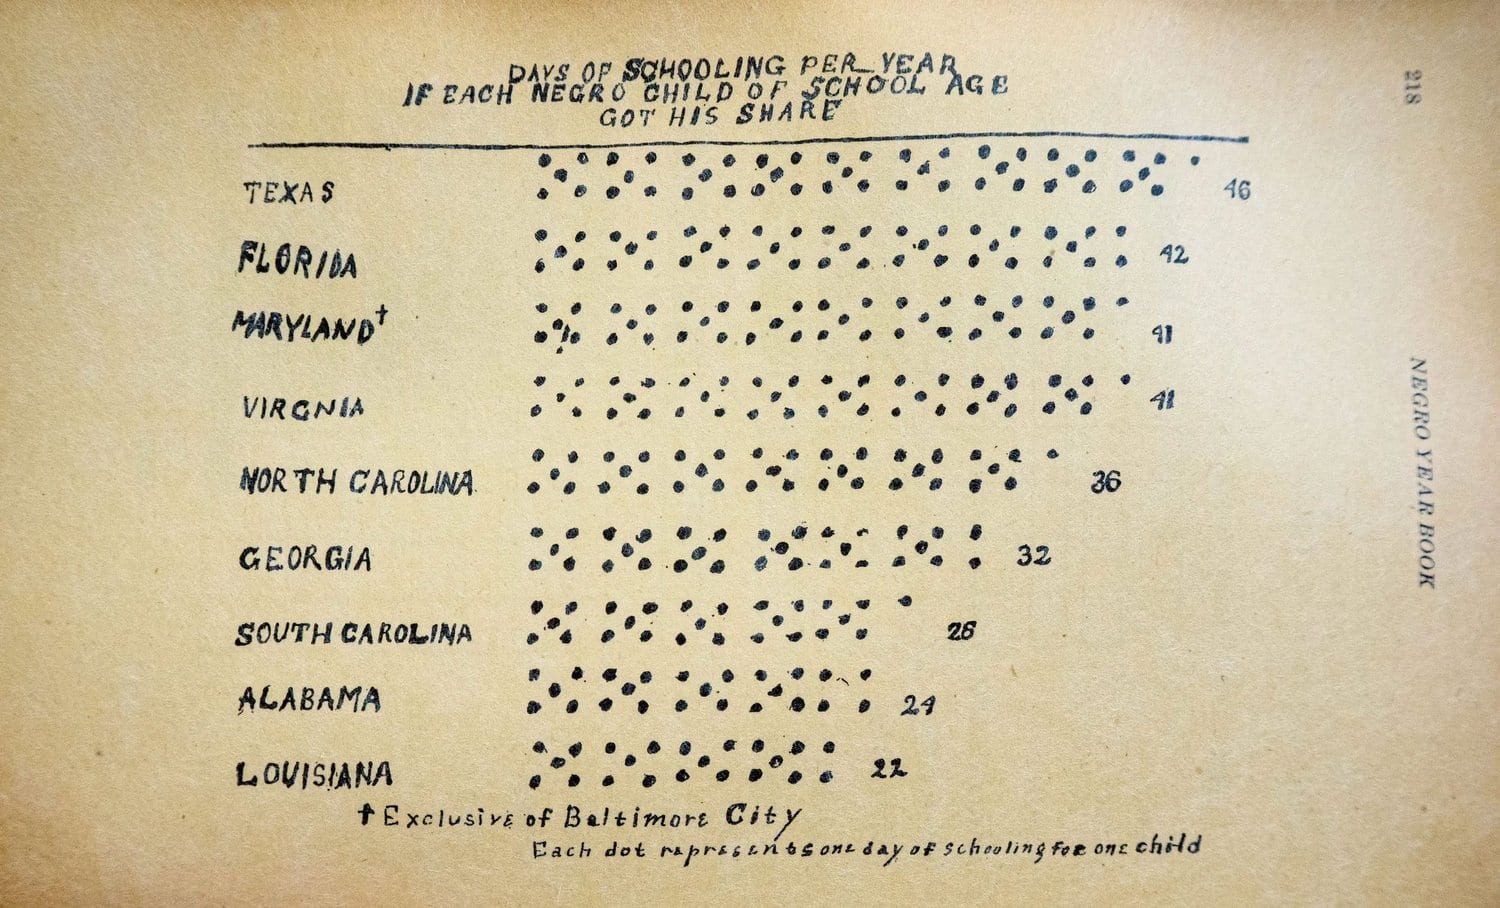
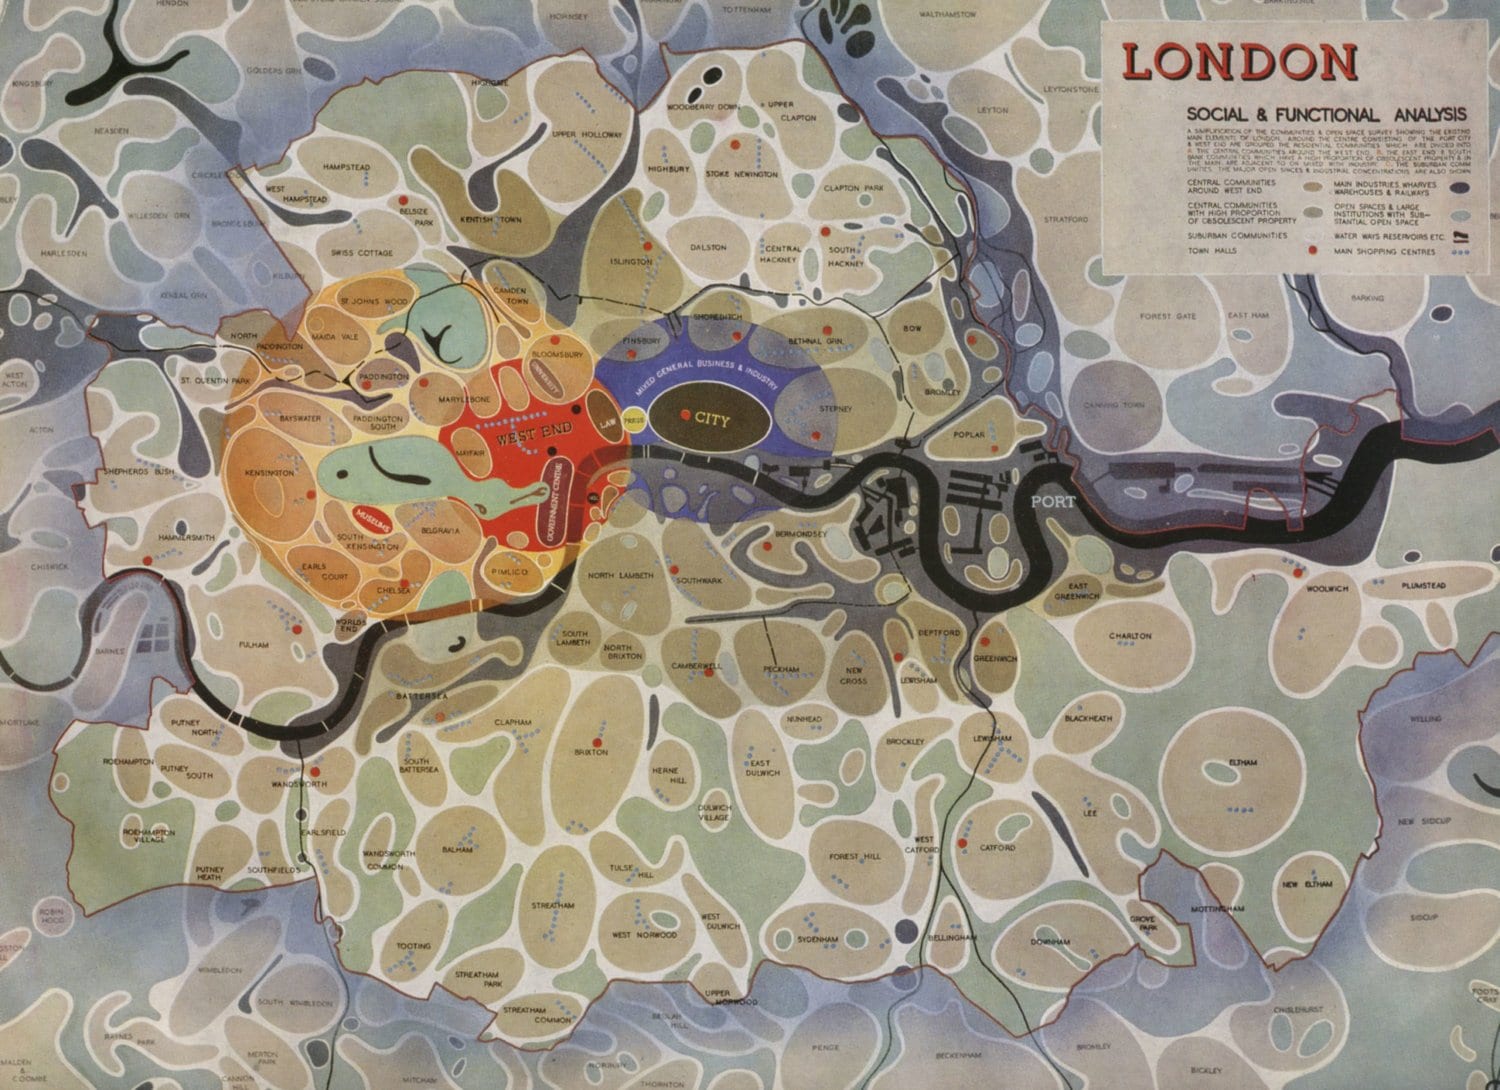
Study history in order to be inspired by it
Dataviz has been around more than 200 years – use it!
Ideas
Where the thinking happens.
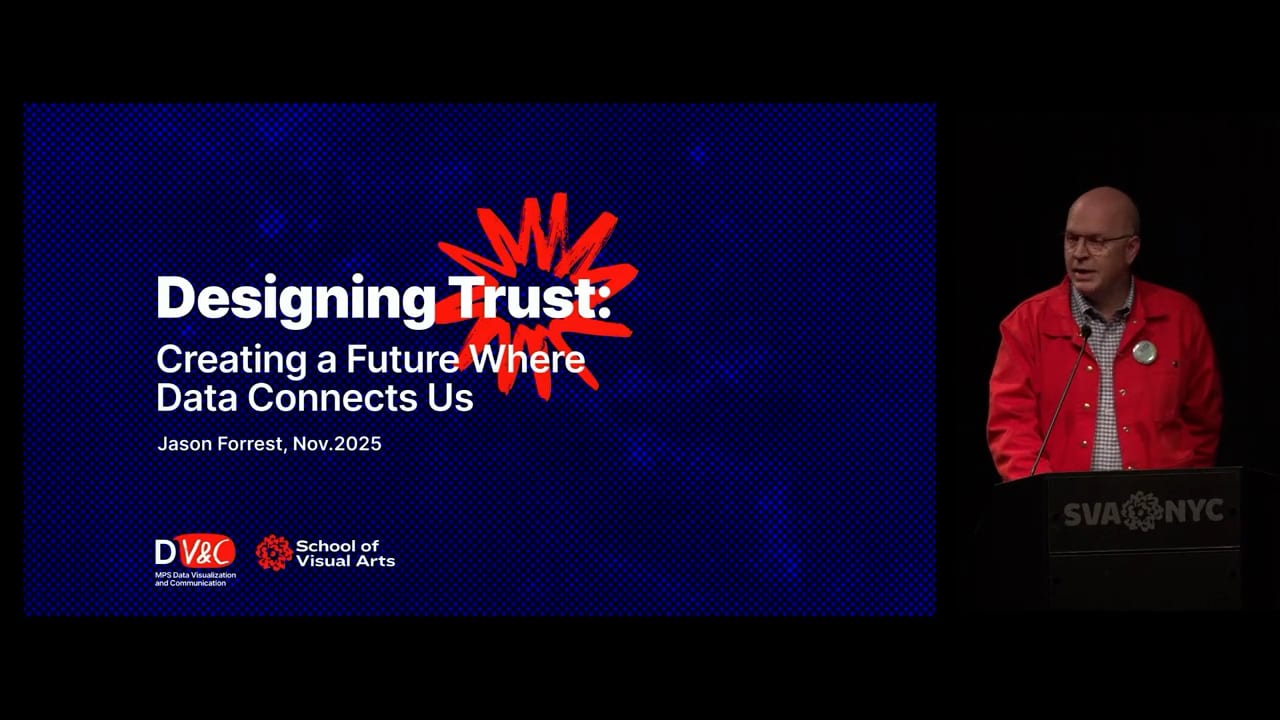
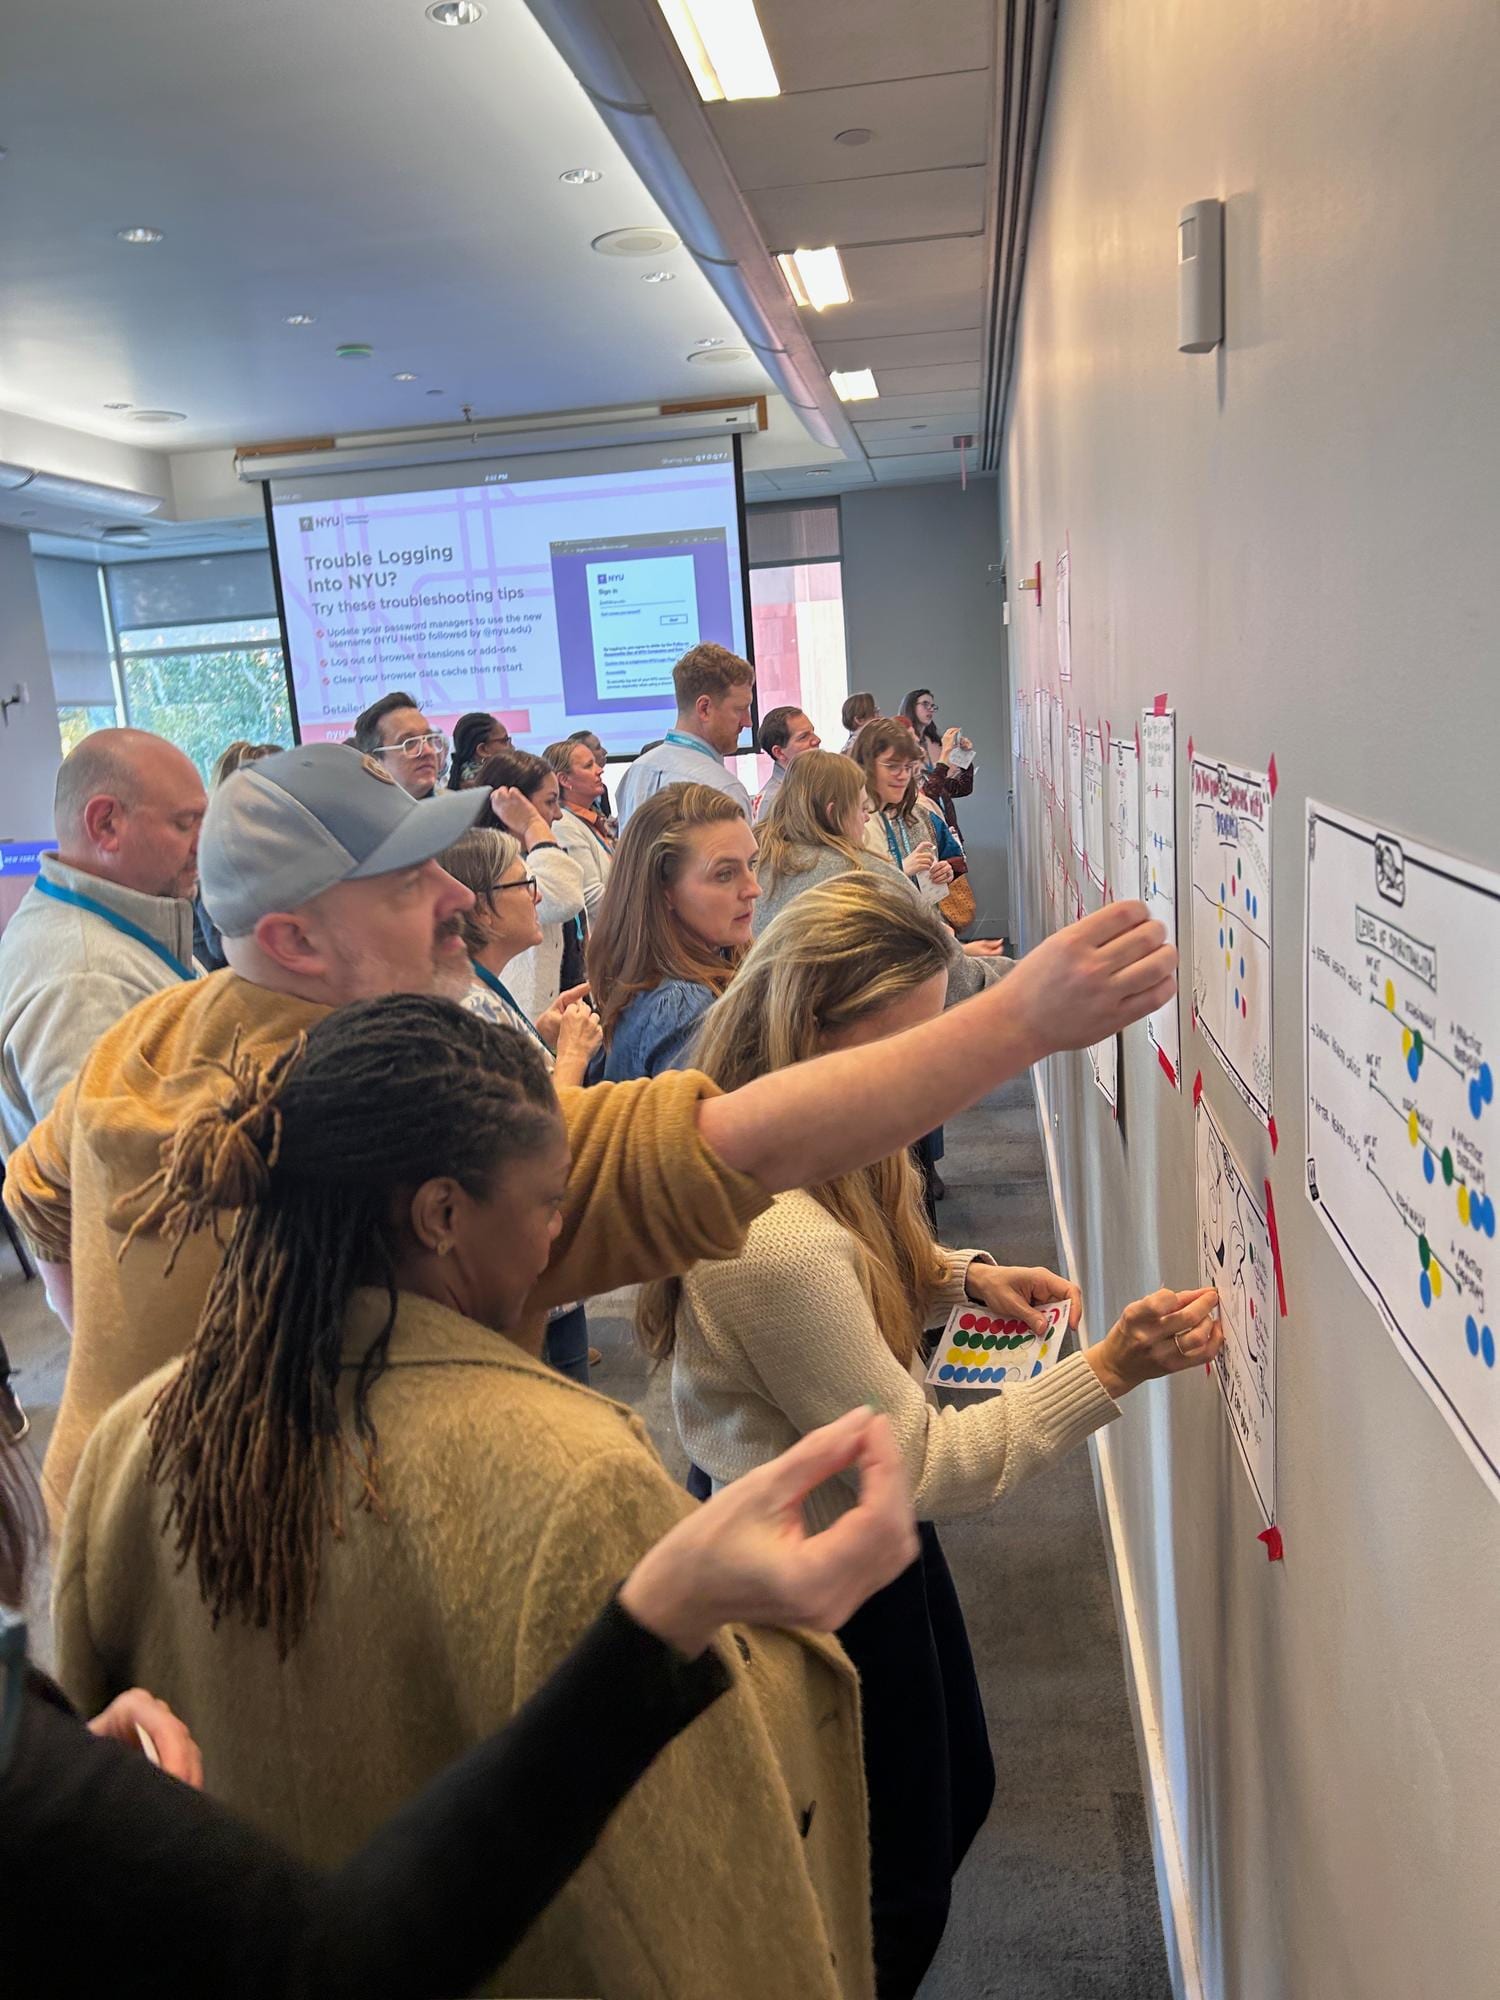
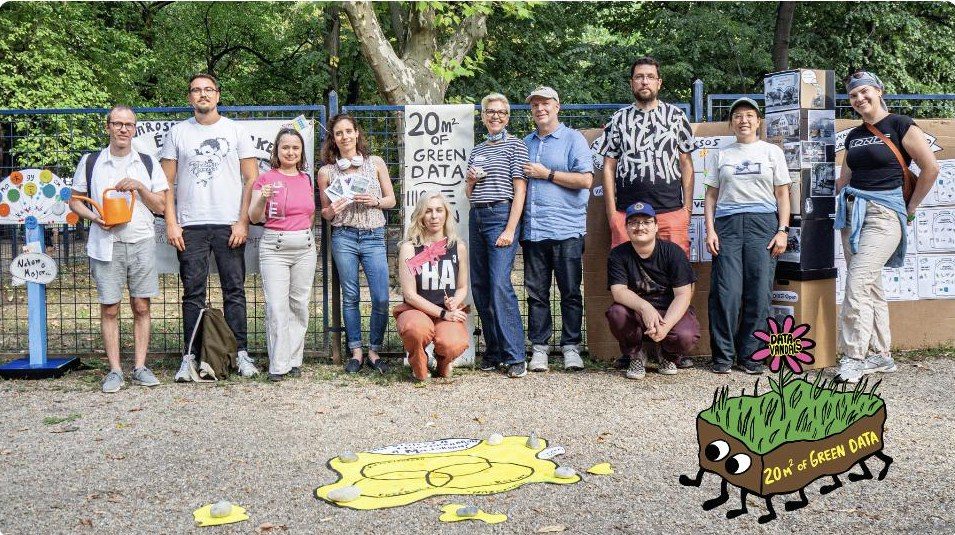
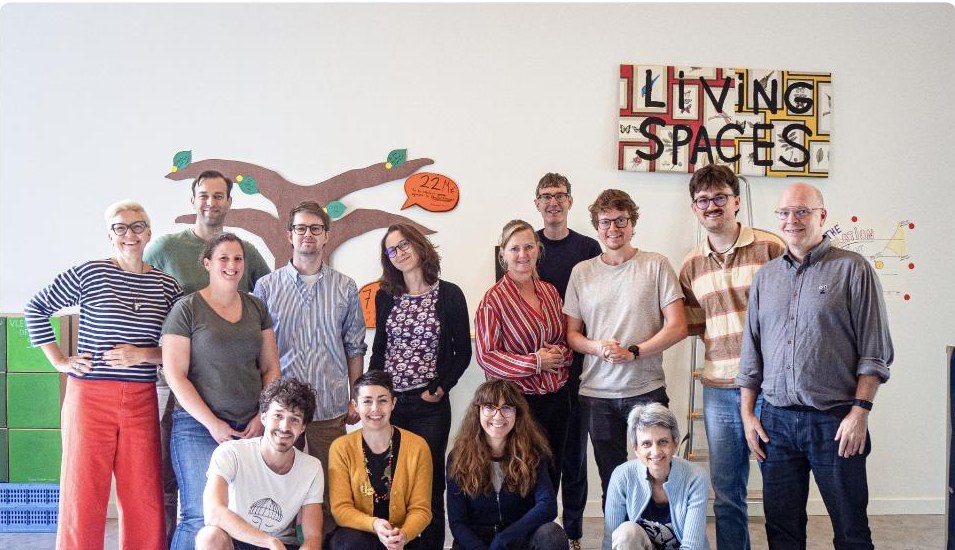
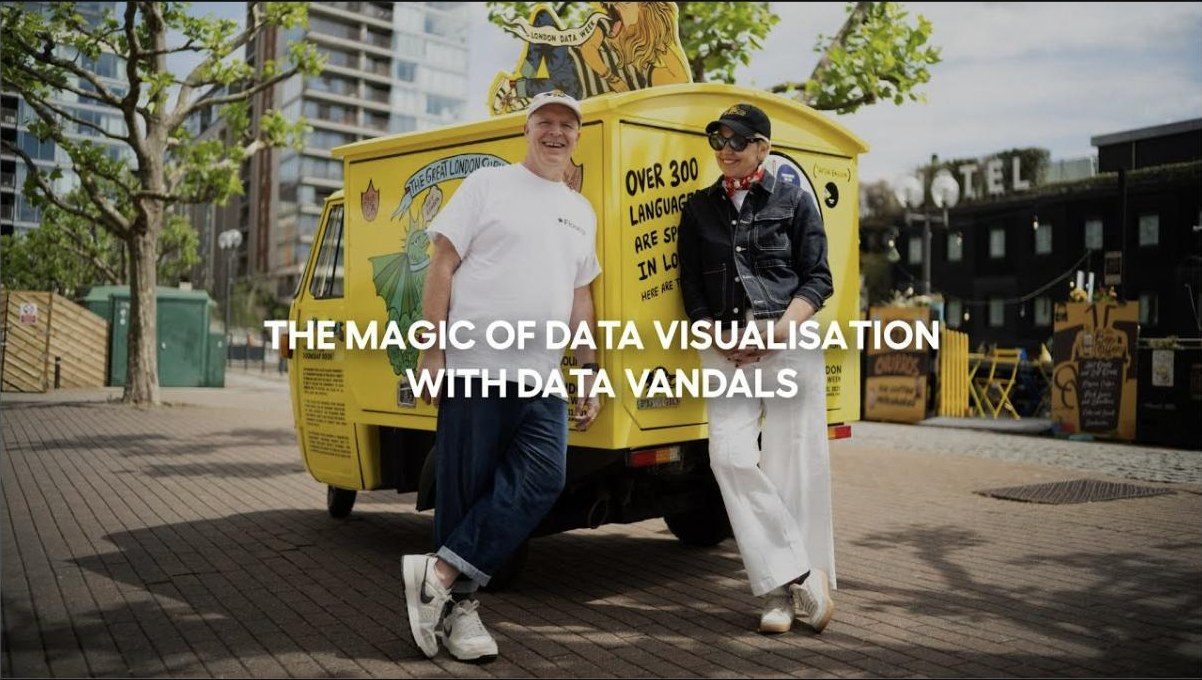
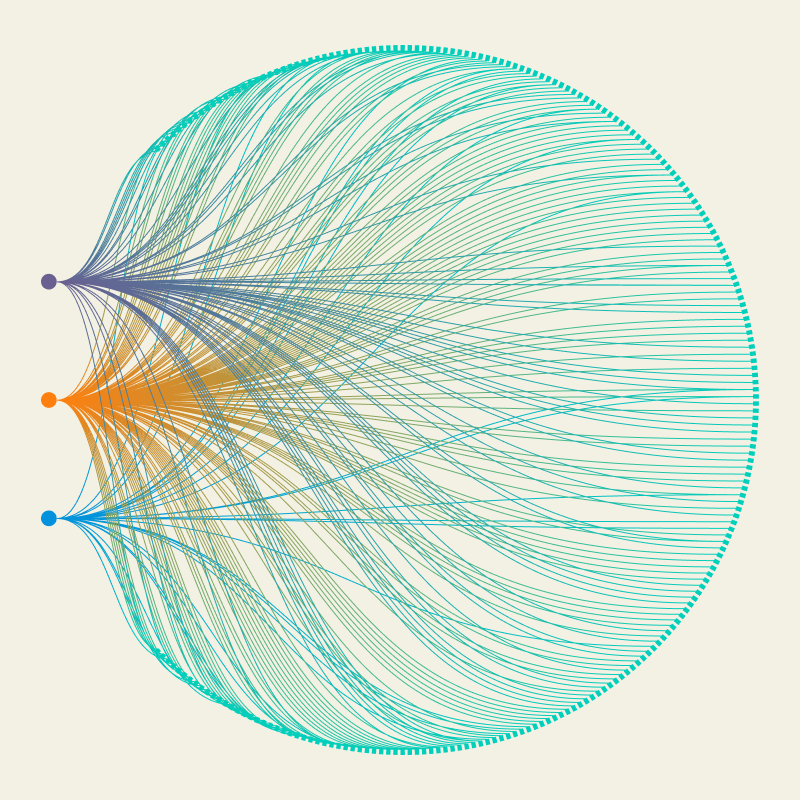
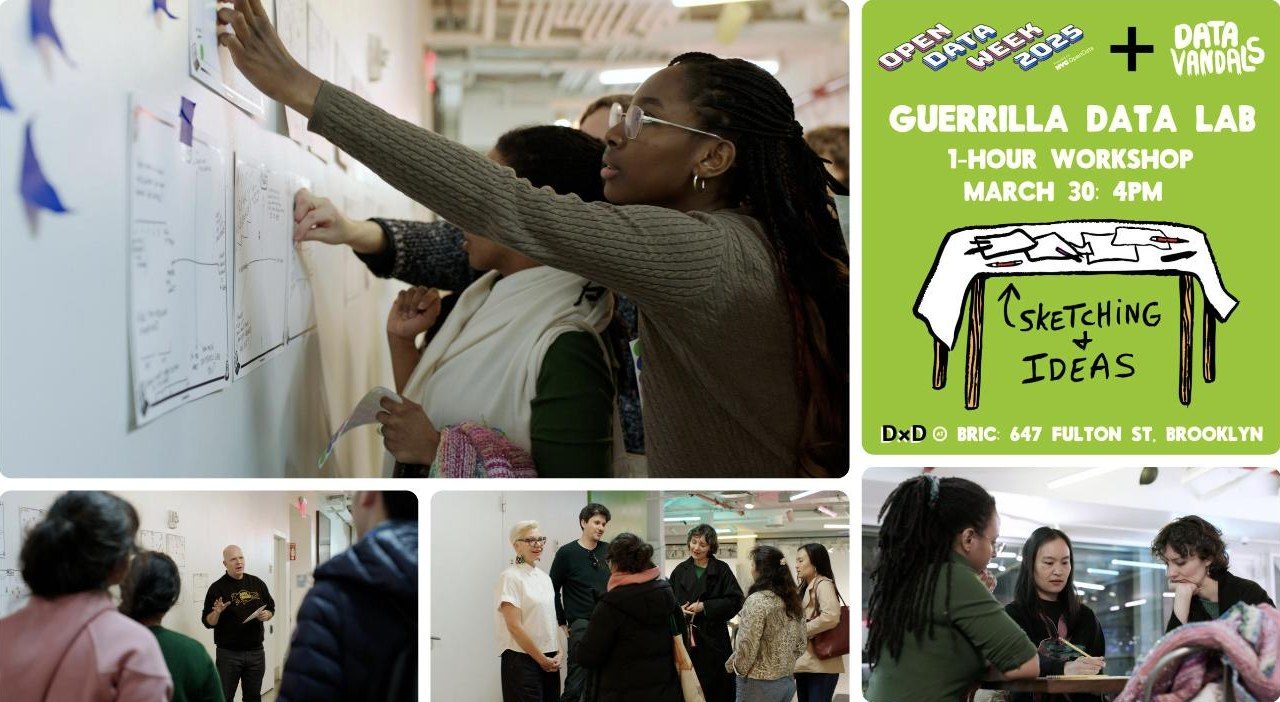
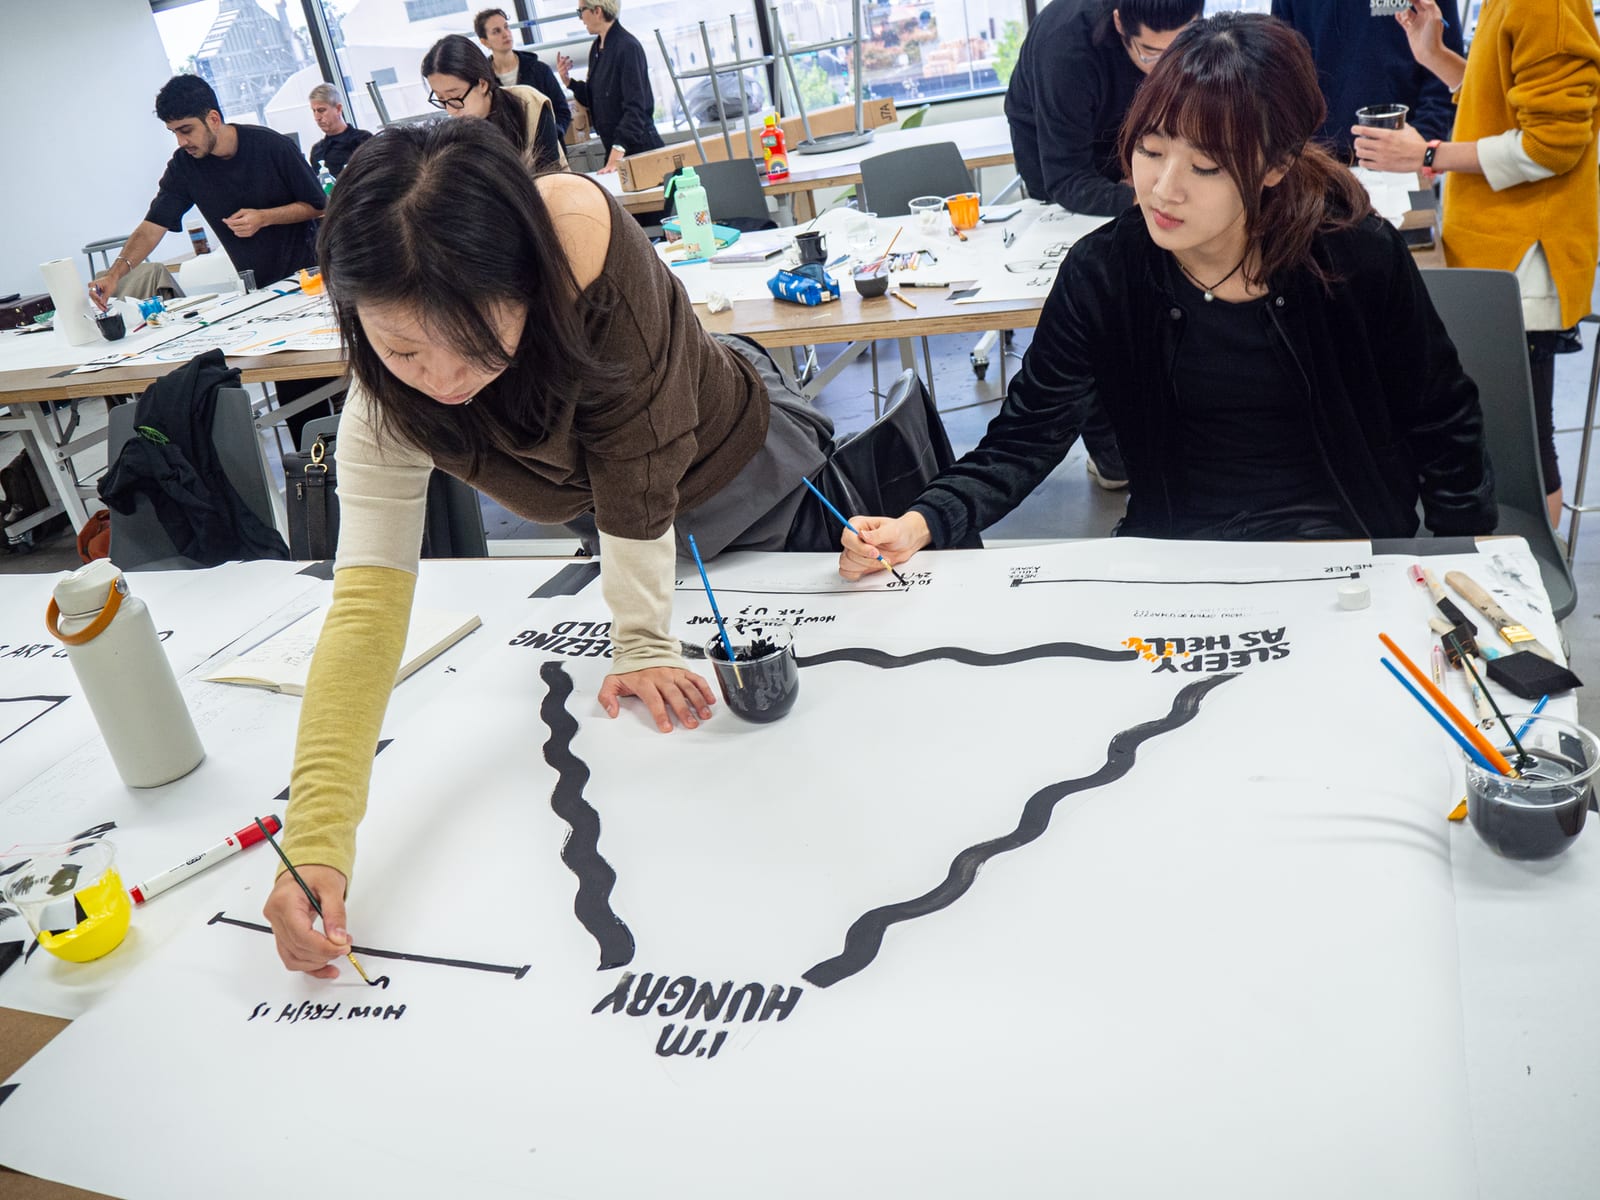
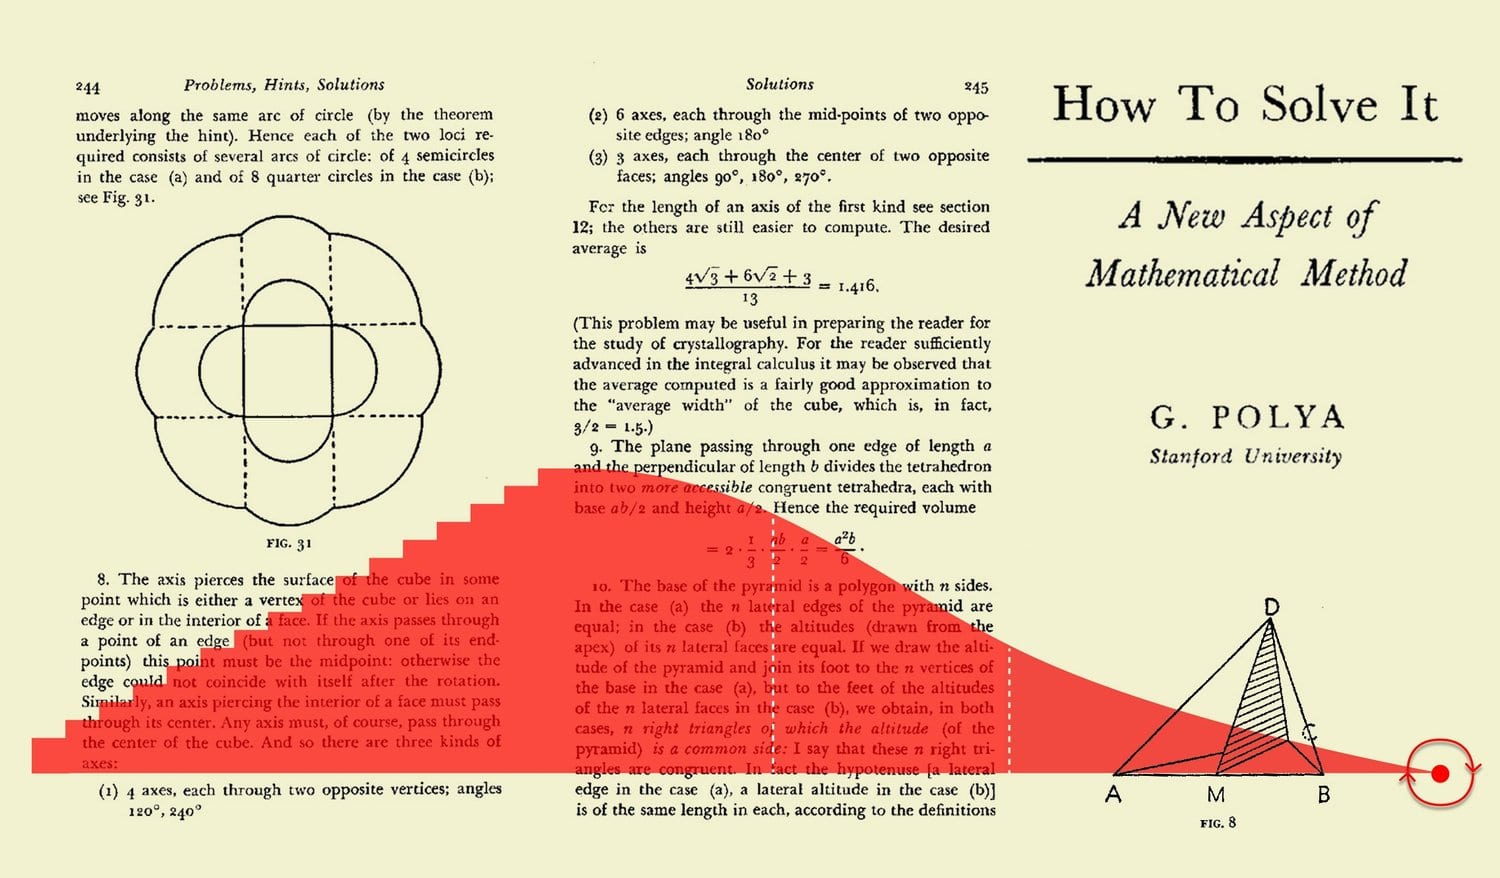
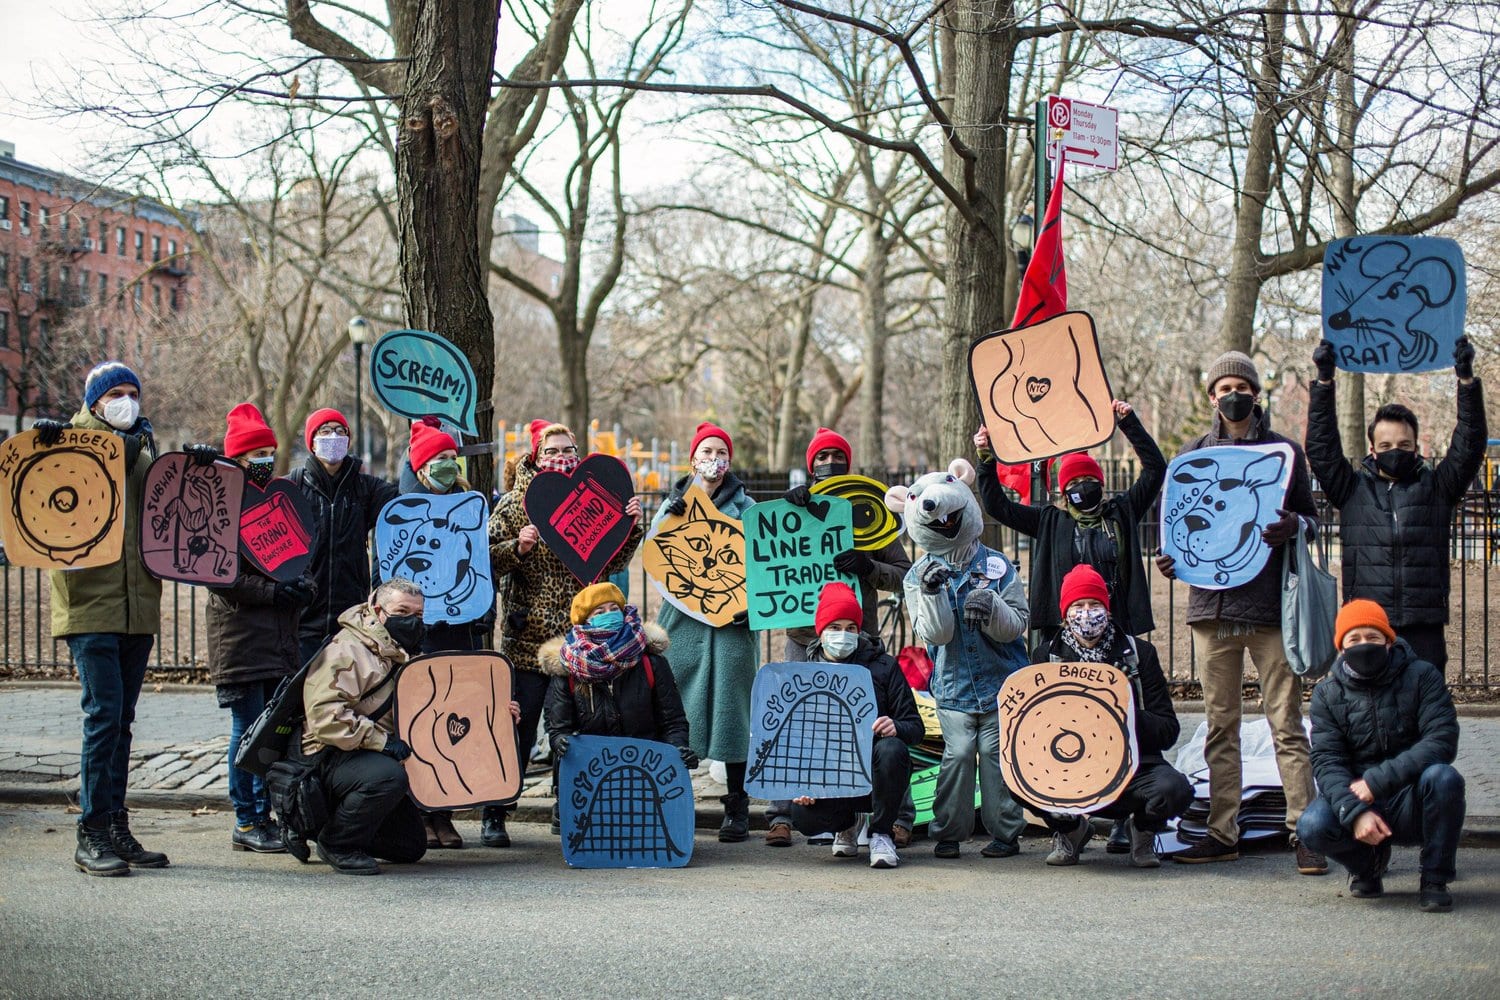
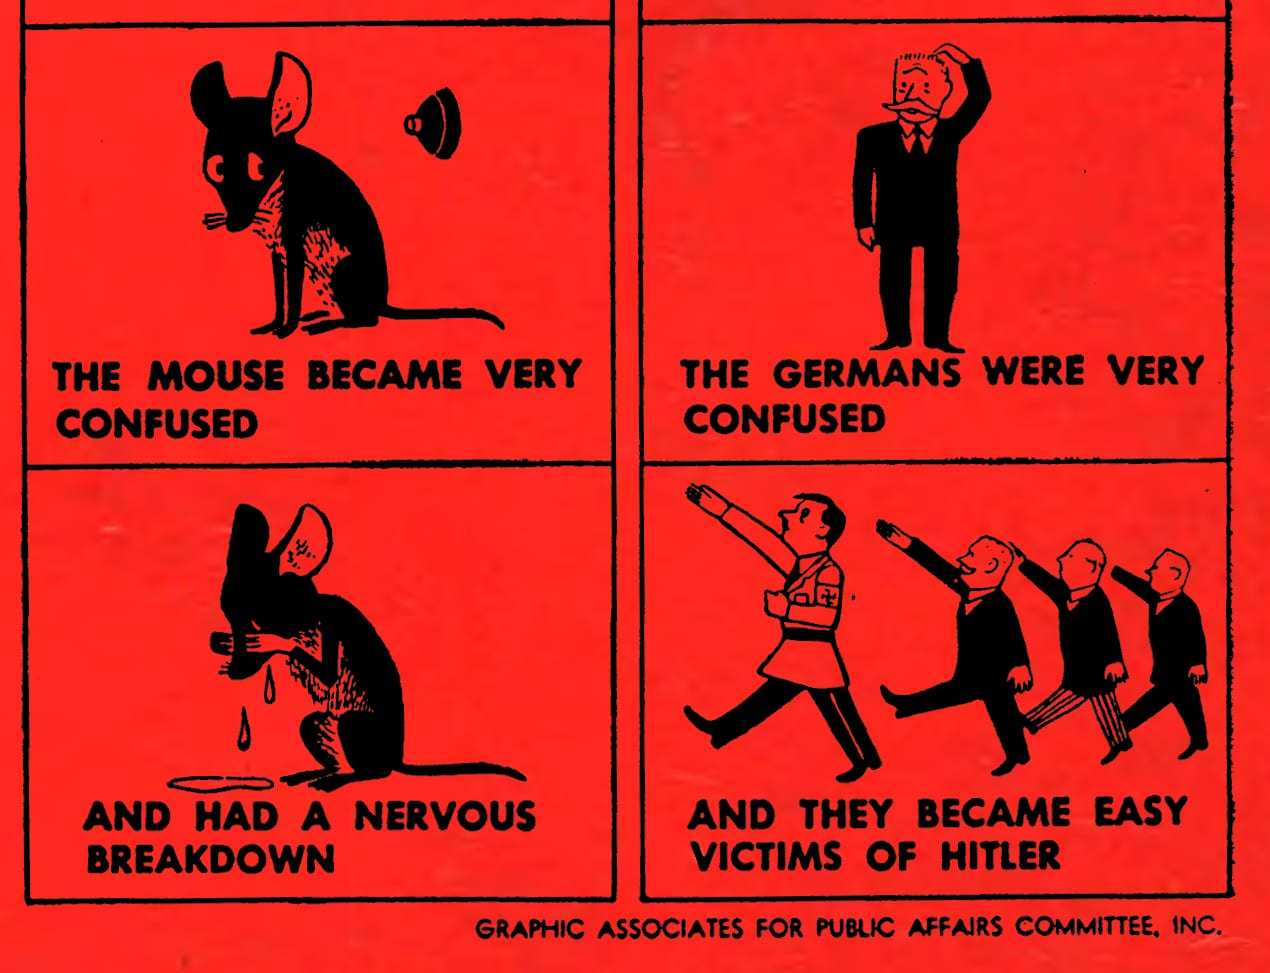
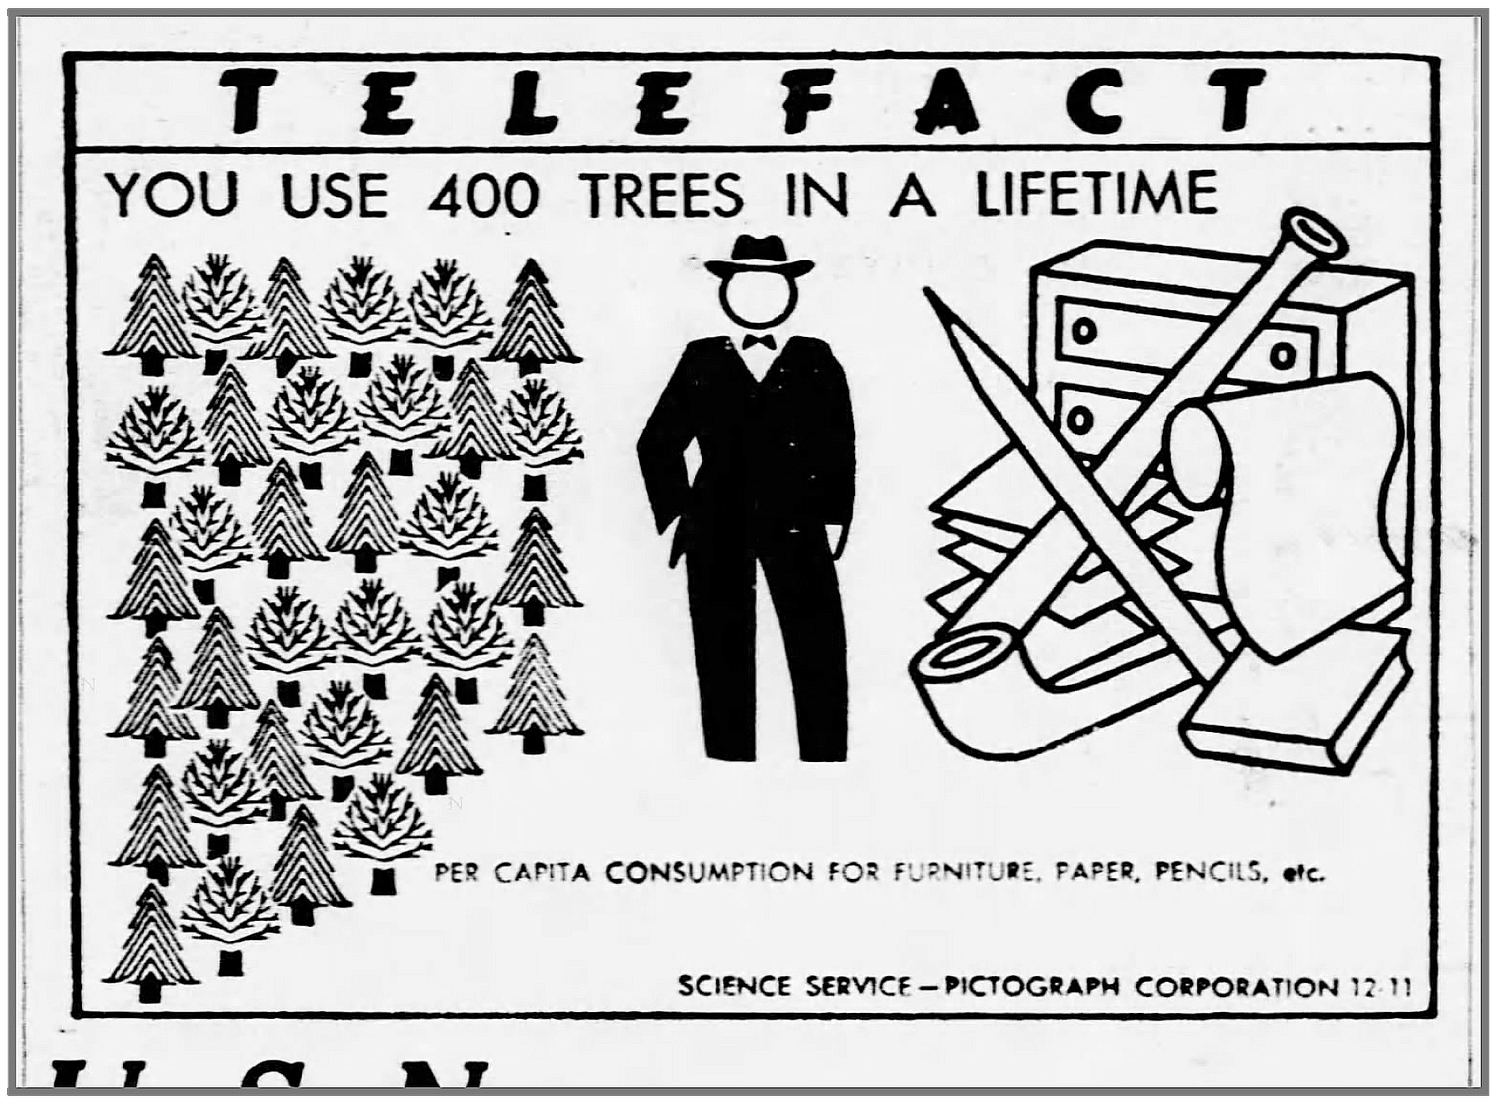
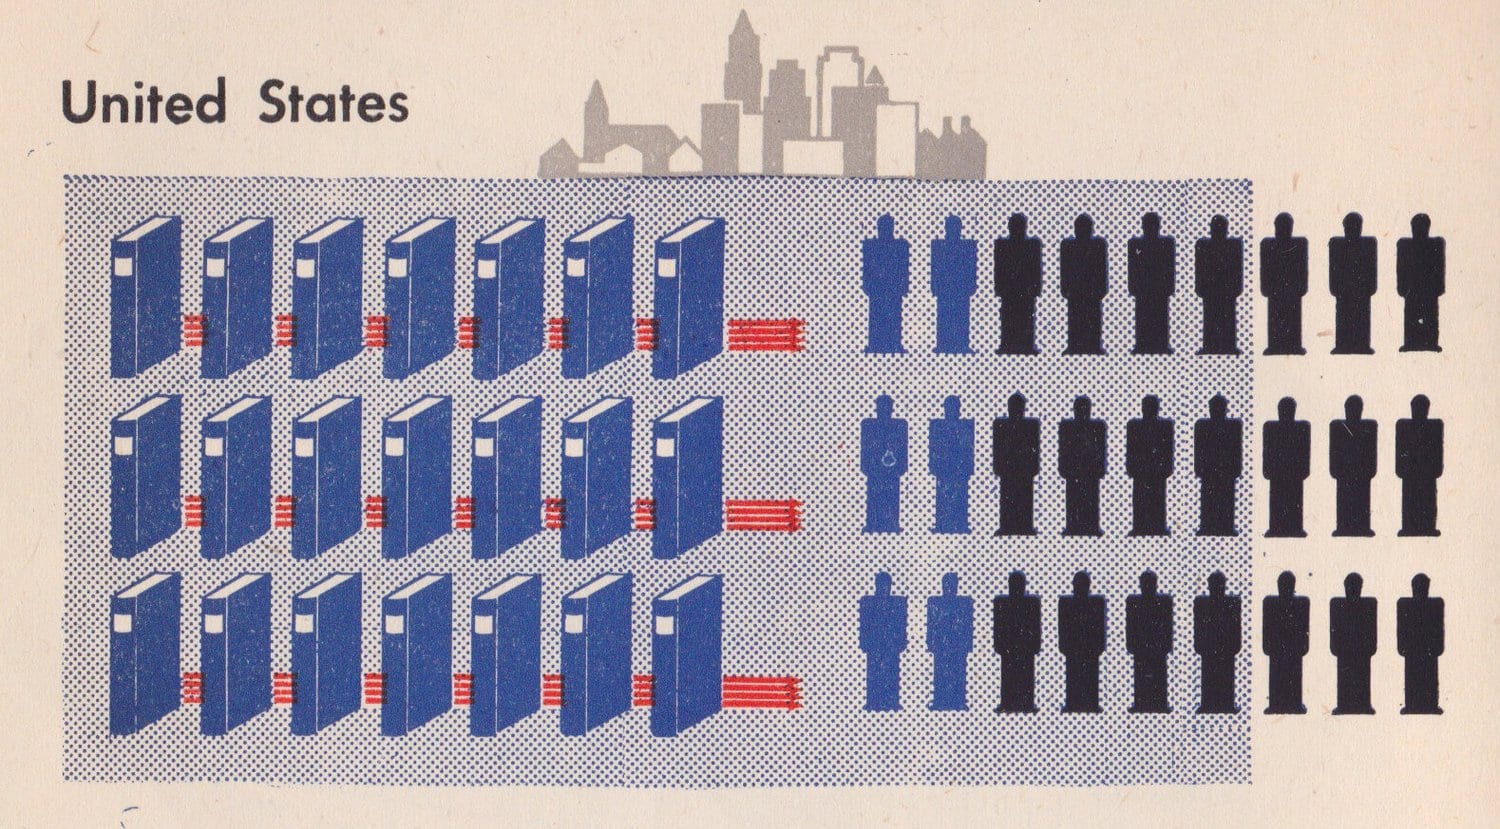
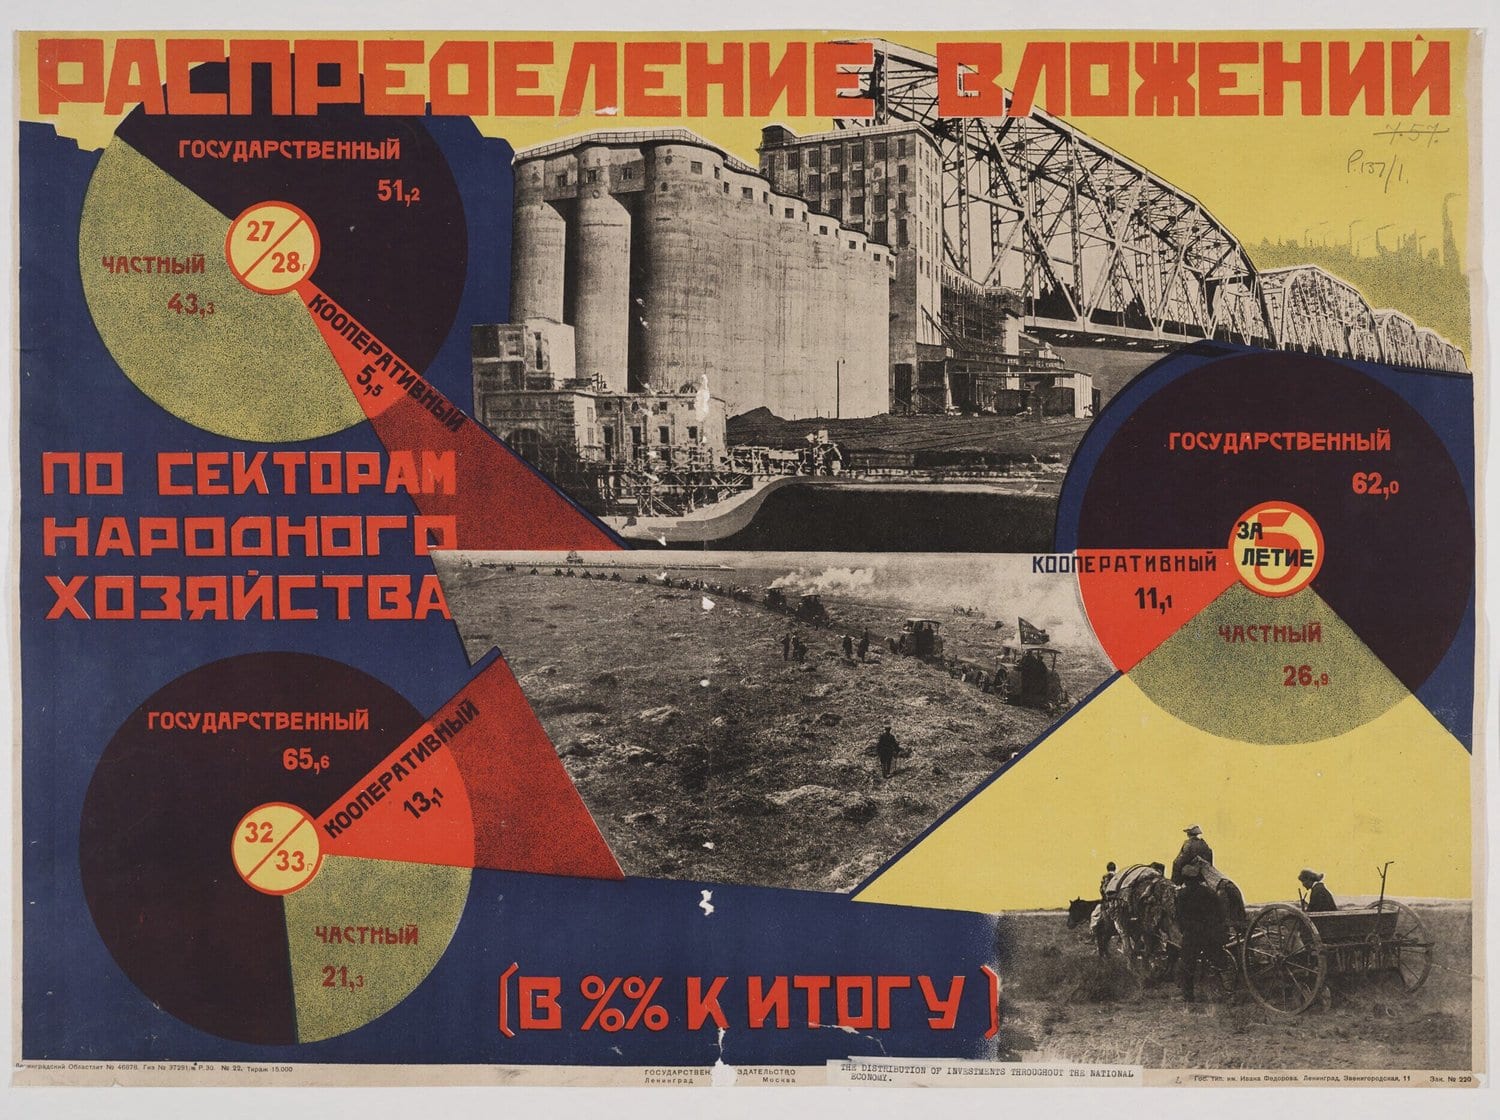
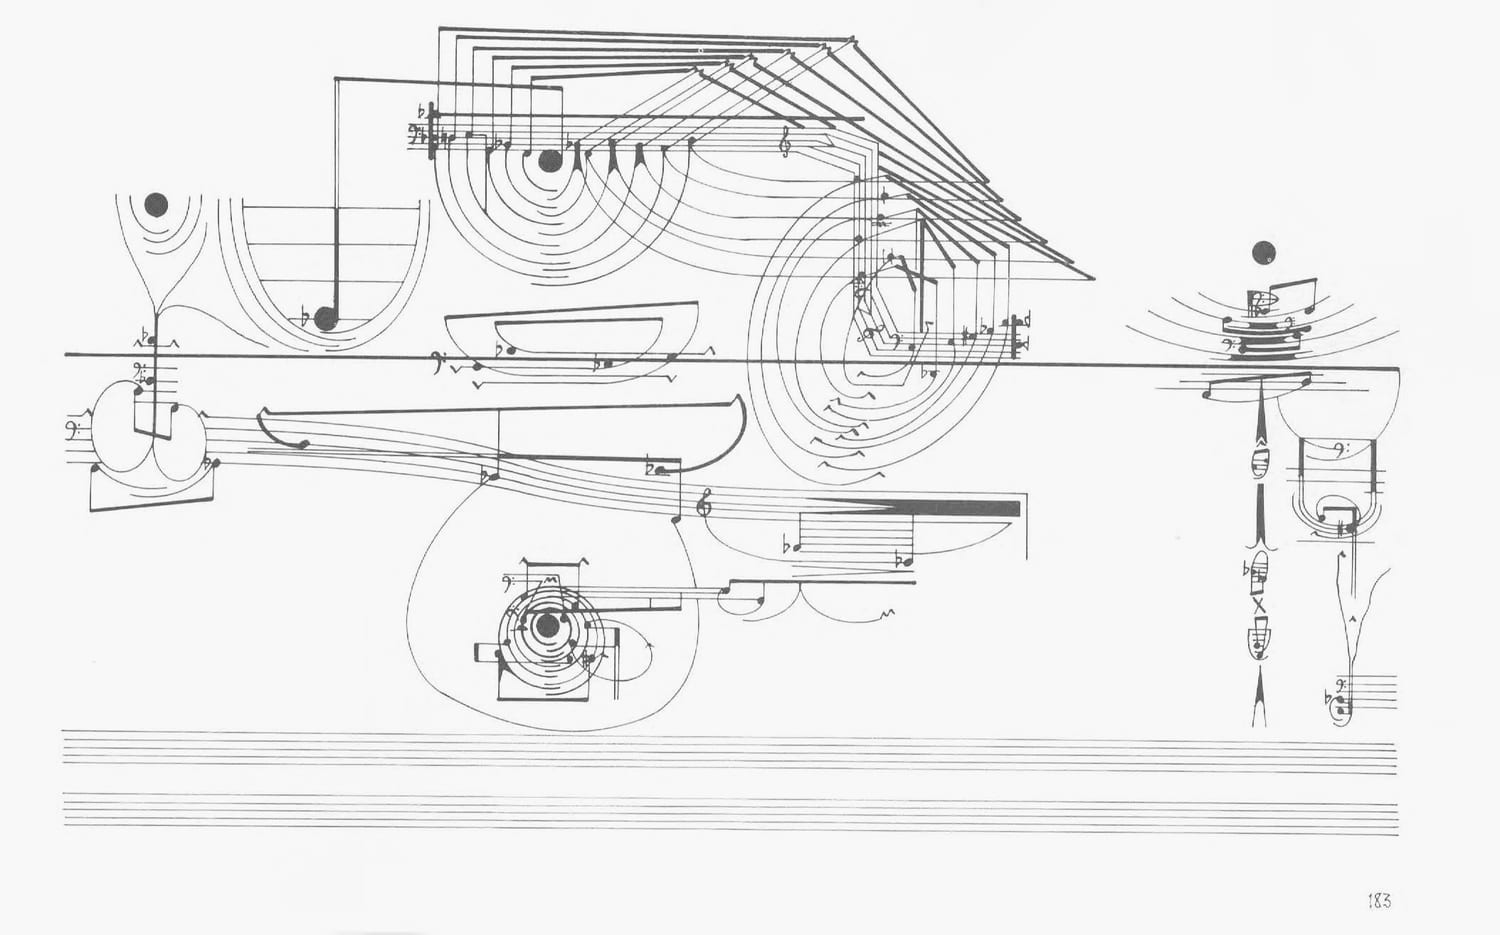
The talks, workshops, exhibitions, interviews and essays where the thinking happens in public. The latest 8 of 51.








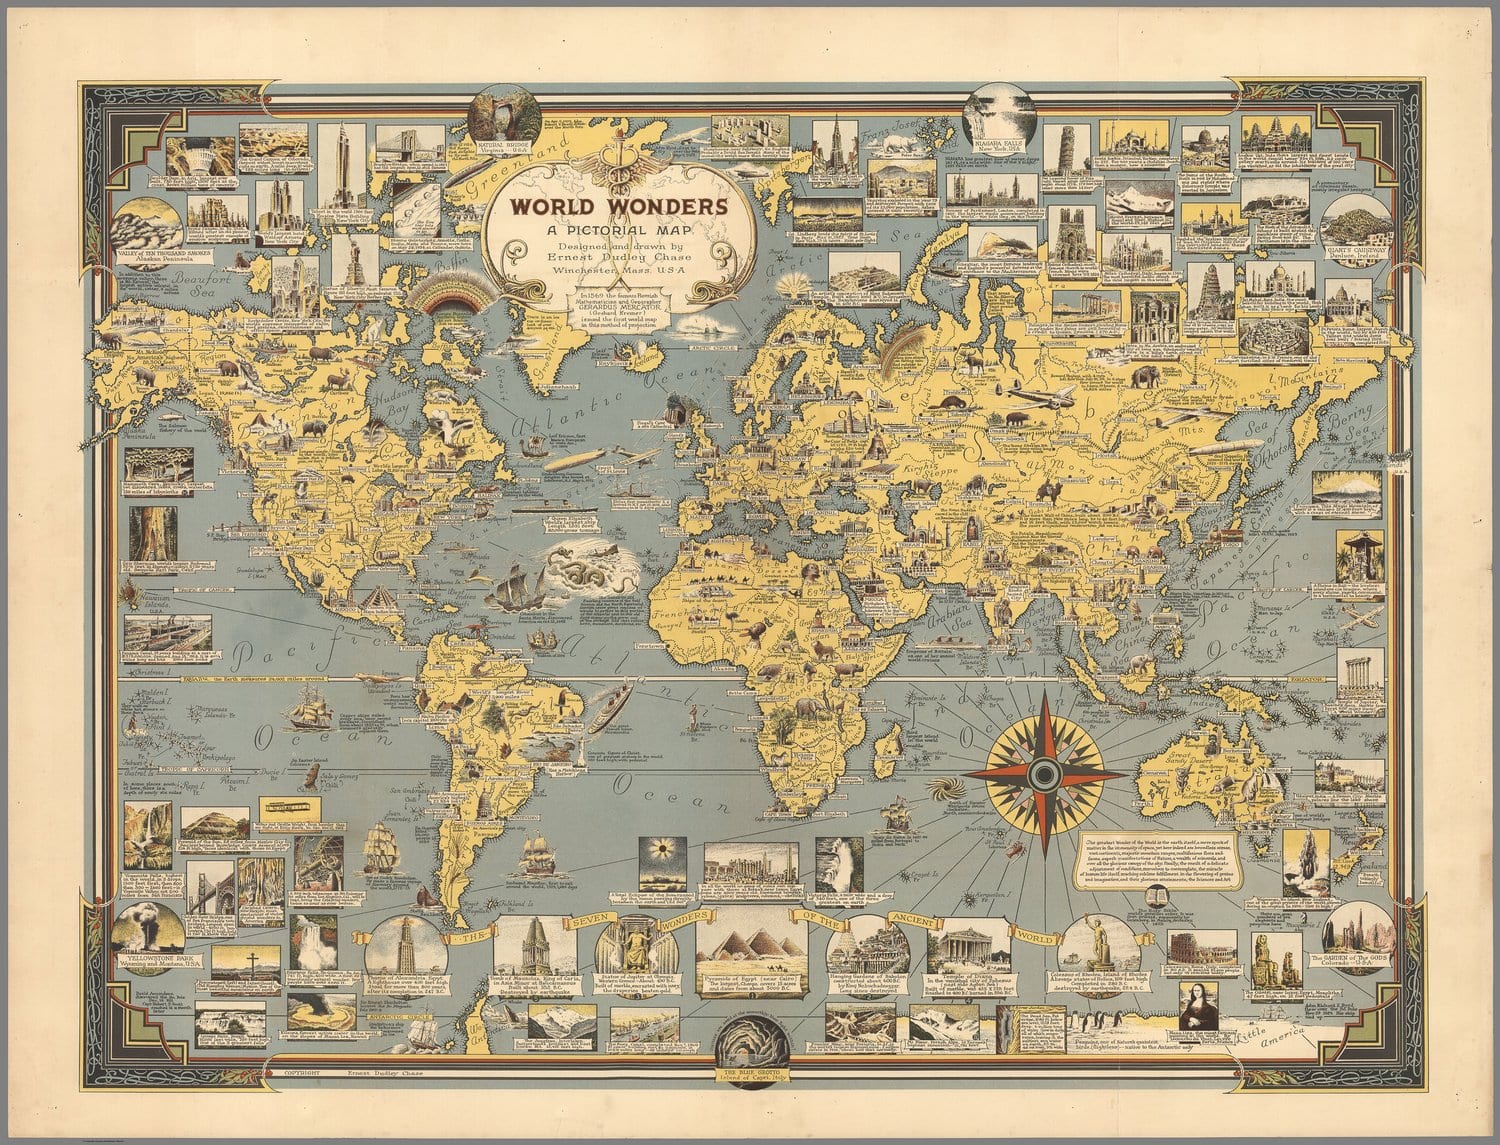
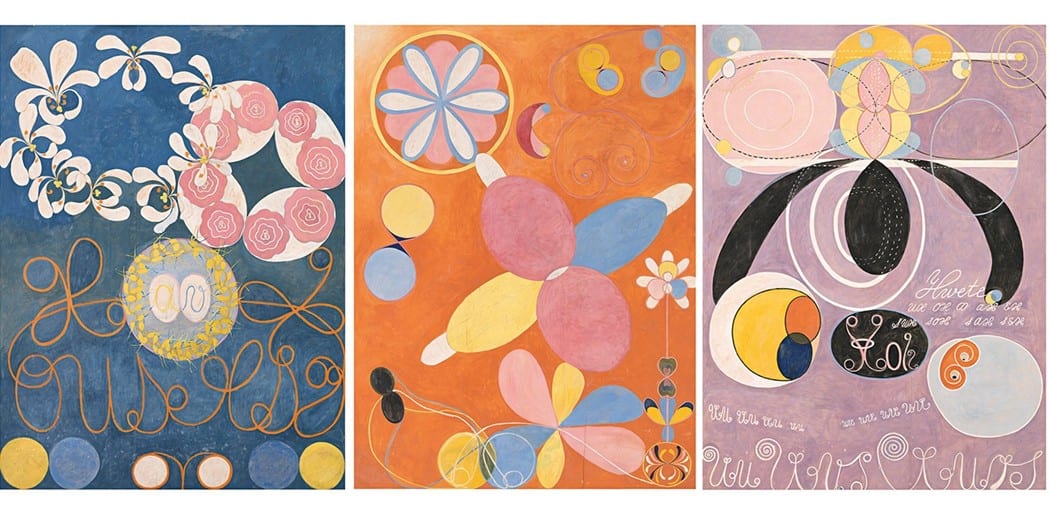
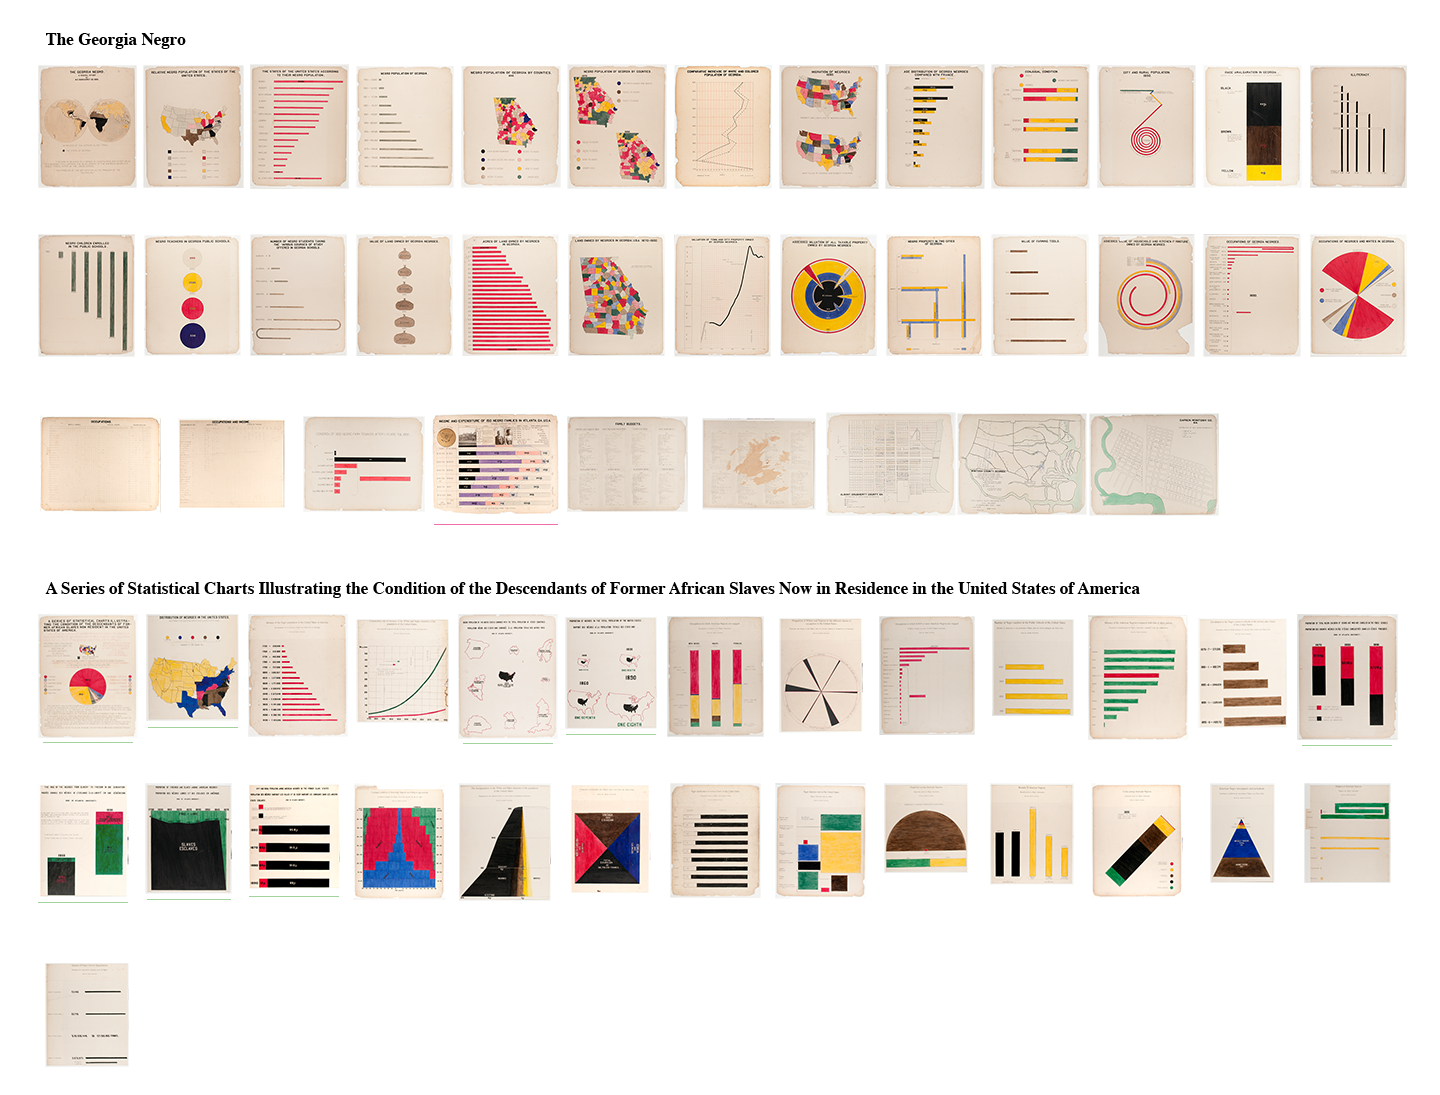
Nothing here yet.
See more
Frequently asked questions
Questions, answered.
Quick answers about our work, process, partnerships, and more. Can’t find what you are looking for? We’re happy to help.
See all FAQsMost projects take between 8–16 weeks, depending on the scope, complexity, and your team’s availability. We’ll share a detailed timeline upfront so you always know what to expect.
New York City. We work with clients across the US and Europe, and our public projects have run in New York, Los Angeles, London, Utrecht and Budapest.
Hello From The Data Vandals, our solo show at The Cooper Union, won an Information is Beautiful Award in 2024.
Start with a conversation. Tell us what you’re trying to make understandable at hello@jasonforrestagency.com and we’ll tell you honestly whether we’re the right people for it.
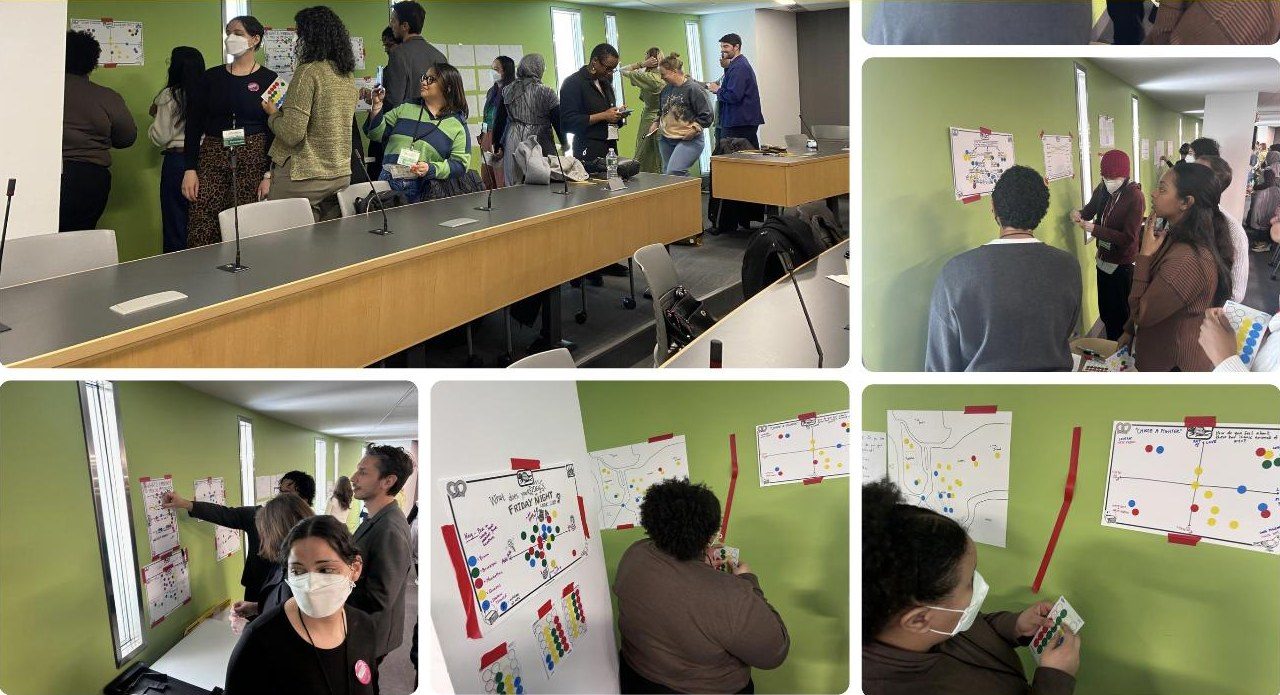
Yes — half- and full-day data communication workshops for teams, and public Data Vandals workshops where a room of strangers builds an exhibition together.
Let’s start a conversation.
Let’s talk about your annual report, a city’s 311 calls, climate risk, a museum installation, your board deck, a dataset nobody reads or extracting data from video.
Tell us what you’re trying to make understandable. We’ll tell you honestly whether we’re the right people for it.
hello@jasonforrestagency.com