Jason Forrest
Turns complex information into human stories — for better decisions and real-world impact.
New York City based data designer and writer
For more details, visit his personal site: jasonforrestftw.com/contact ↗

About Jason Forrest
Jason Forrest is a data visualization and design leader who turns complex information into human stories for better decisions and real-world impact. Based in New York City, he leads two agencies built on one shared mission: to make data more relatable, intuitive, and human.
Through the Jason Forrest Agency (JFA), a collective of top dataviz, design, and AI talent, he partners with Fortune 100 companies, NGOs, and cultural institutions to build full-stack visualizations, exploratory tools, and experiential interfaces that help organizations see and act on their data — turning insight into faster, more empathetic decisions.
Data Vandals, the public-facing data-art studio he co-founded with Jen Ray in 2021, brings that same mindset into sculptures, murals, and pop-up activations, like LA Loves with the Mayor’s Office of Los Angeles for the World Cup’s Kick It in the Park celebrations, that turn data into unforgettable experiences and spark curiosity and conversation across audiences.
Before founding JFA, Forrest was an Associate Partner and Director of the Data Visualization Lab at McKinsey & Company. He started there as a UX designer, moved into data visualization through people analytics, and ended up at the center of the firm’s biggest public moments: launching the McKinsey Health Institute, a sustainability campaign for COP26, the Future of NY Summit — and, when the pandemic hit, the COVID Response Center, home of the Emotion Archive and its most-viewed page, the Vaccination Distribution Map.
He founded Nightingale, the journal of the Data Visualization Society, in 2019 and edited it until 2024 — first on Medium, then as a website, and from 2023 as a print magazine with 2,000+ subscribers in 59 countries. He writes about the history of information design, from the data portraits of W.E.B. Du Bois to the design and methodology of Isotype.
Three ideas drive the work.
Community
One has to participate in a community to be part of one. Through it: friendship, intellectual stimulation, and a sense of belonging.
History
How culture evolves, shapes our history, and connects us through lessons that guide our future.
Entrepreneurship
Energy, an ability to help people organize, and the drive to make sustained progress toward a goal.
Lectured at:
Want Jason to speak, teach, or take on your data?
Taking the long way
Before the data, there was a lot of noise.
Music, broadcast, software, community — a career he charts as one thread: connect with people through history and culture, build a community around it, then make something new.

2004
Best New Music
Pitchfork named his album Best New Music — and he went on to play Glastonbury, Primavera Sound, Mutek, Lowlands and Pukkelpop.
2001
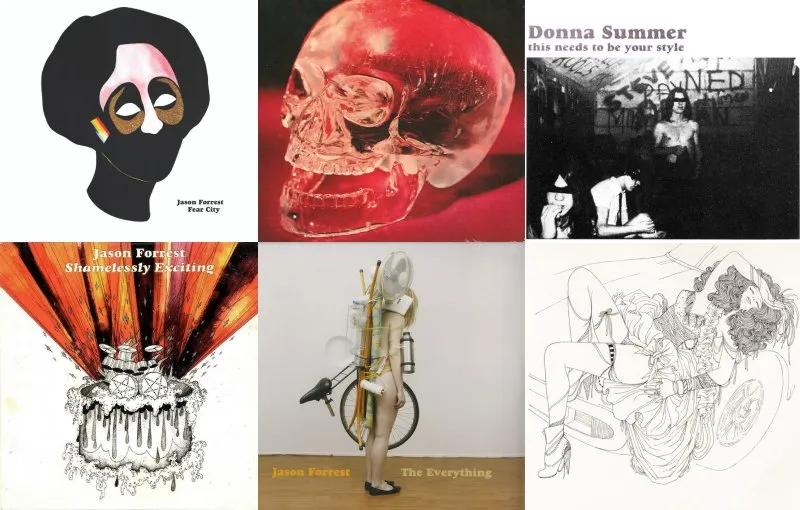
Cock Rock Disco, 25 years
The breakcore label he launched in 2001 — scores of albums, vinyl and CDs — turns 25 this year.
2008
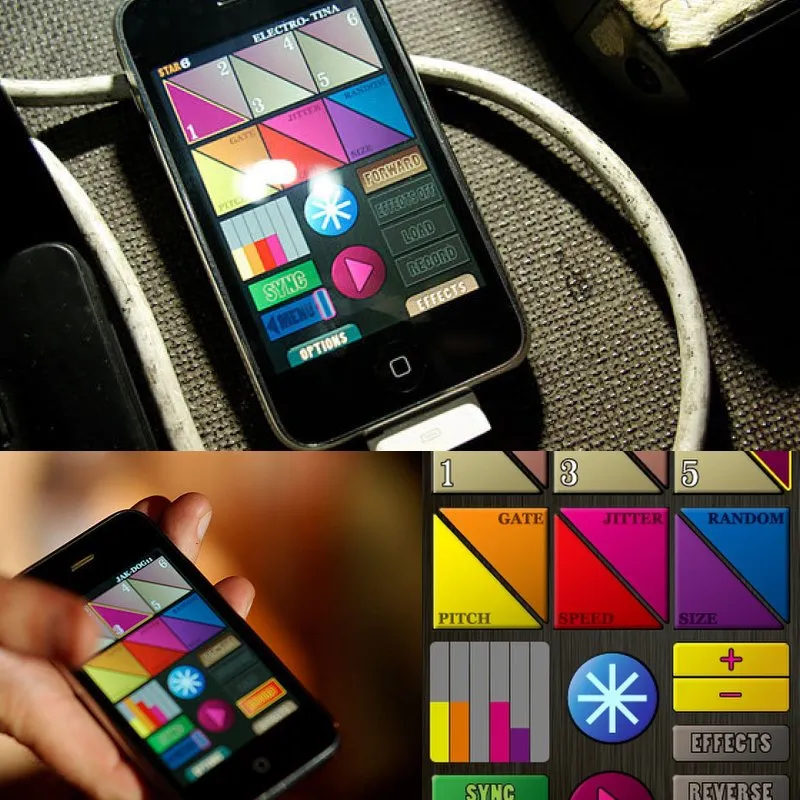
Star6
An iOS instrument built a month after the App Store opened. Front page of iTunes in 17 countries; about 70,000 sold.
2019
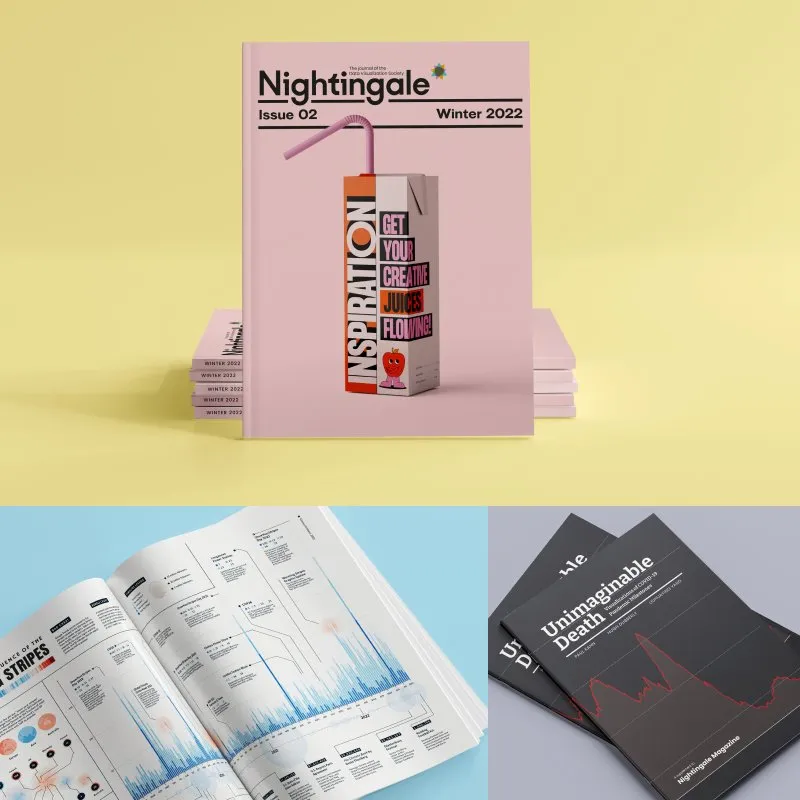
Nightingale
Founded the Data Visualization Society’s journal and edited it to 2024: 6M+ views, and a print magazine in 59 countries.
2002–08
Advanced D&D on WFMU
Hosted the influential radio show, and co-founded Berlin’s Wasted Festival with Club Transmediale in 2005.
2005
Jon Watts’ first video
“Steppin Off” was the first music video by Jon Watts, later director of Spider-Man: Homecoming. Res magazine’s video of the year.
2011
Network Awesome
Online TV curated from 80,000 YouTube videos by 270 volunteers — 5M views. Its sister company took Boiler Room to multicamera HD.
The long version, with music, videos and press: jasonforrestftw.com/contact ↗
On stage
Lectures, talks and workshops.
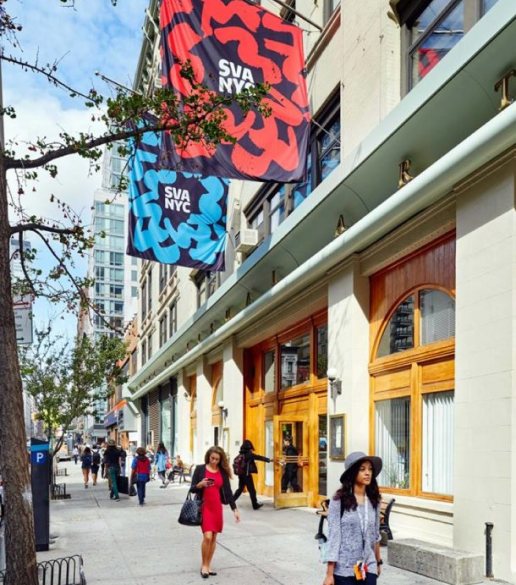
- UpcomingWorkshopSchool of Visual Arts, New YorkData in Public Spaces — a 3-day Data Vandals workshop15-17 OCT 26New York
- UpcomingTalkNortheastern University CAMDMedia in Motion II: Shaping AI for Critical Creative Futures29 OCT 26Boston
- UpcomingTalkHarvard Kennedy SchoolGuest lecture at the Harvard Kennedy SchoolNOVEMBER 2026Cambridge, MA
- PastTalkThe Newsstand, 51st & LexHow do you have a conversation with a city? NY Tech Week at the newsstandJUNE 2026New York
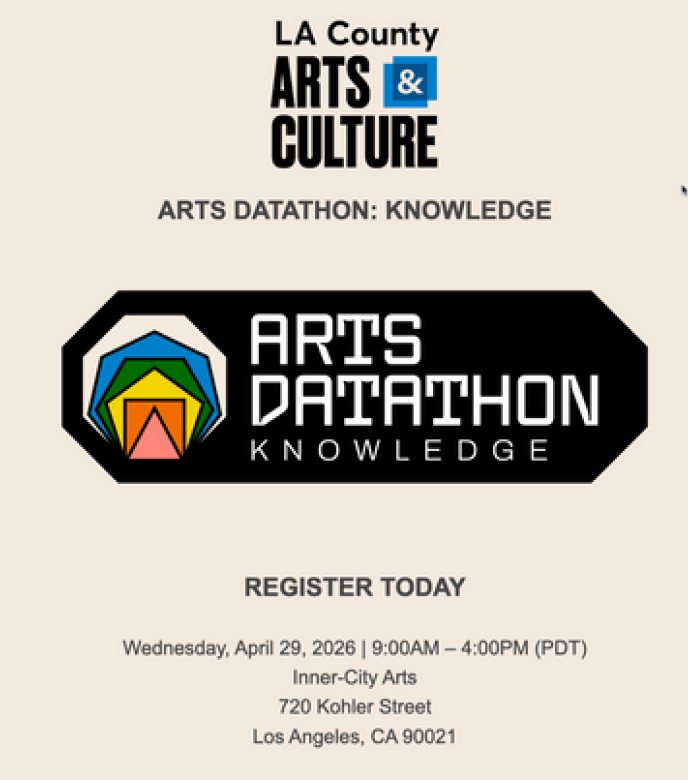
- PastWorkshopInner-City Arts, Los AngelesArts Datathon, Los Angeles29 APR 26Los Angeles
- PastWorkshopNYC School of Data, New YorkNYC School of Data: sketching and polling with the open-data crowd28 MAR 26New York
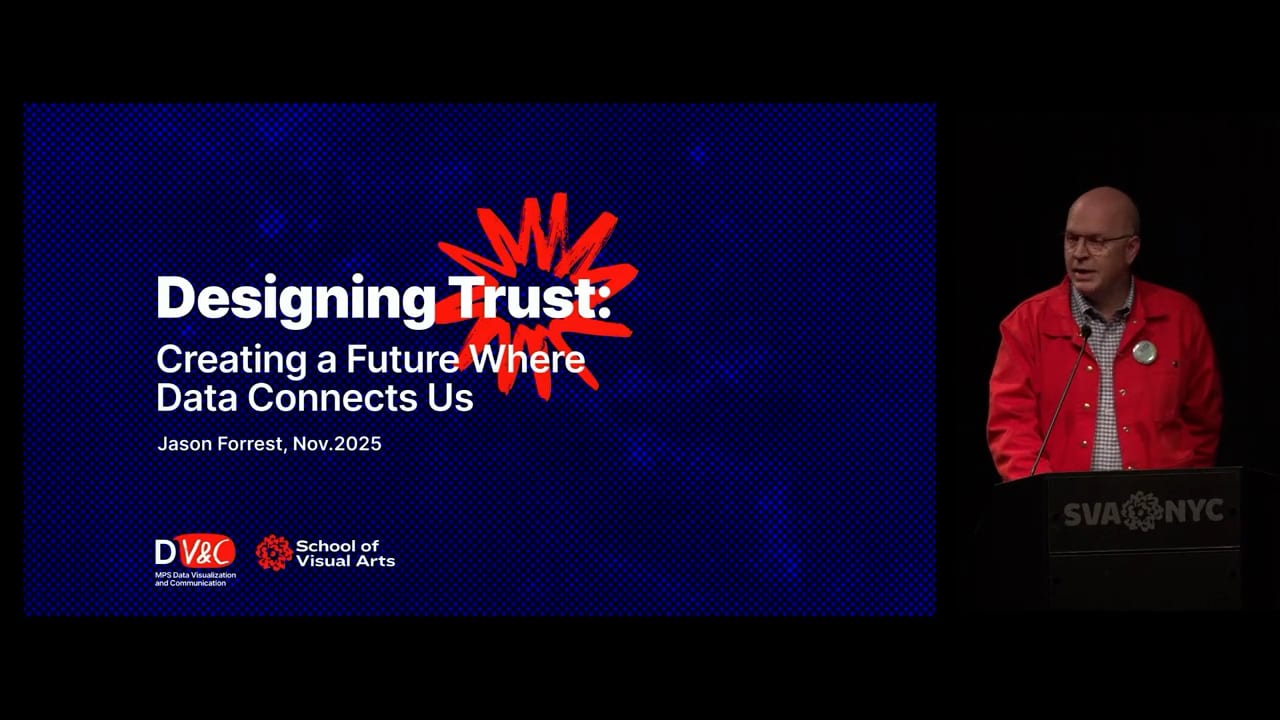
- PastTalkSchool of Visual Arts, New YorkDesigning Trust: Creating a Future Where Data Connects UsDECEMBER 2025New York
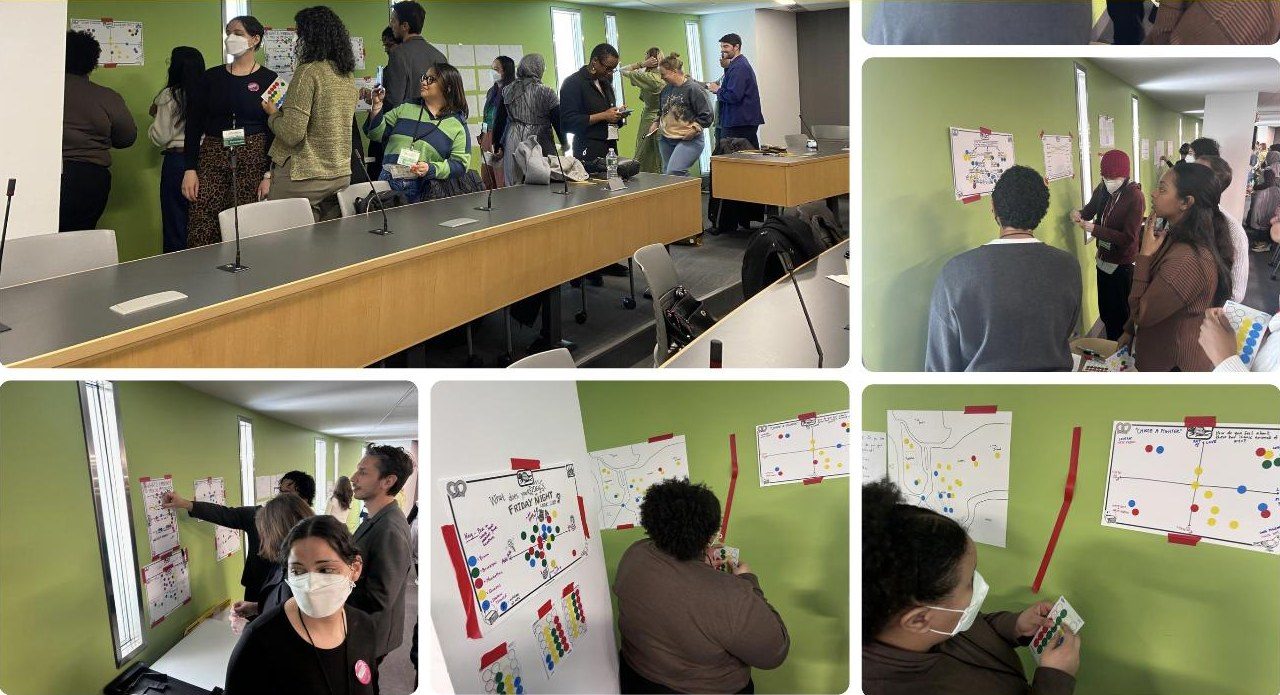
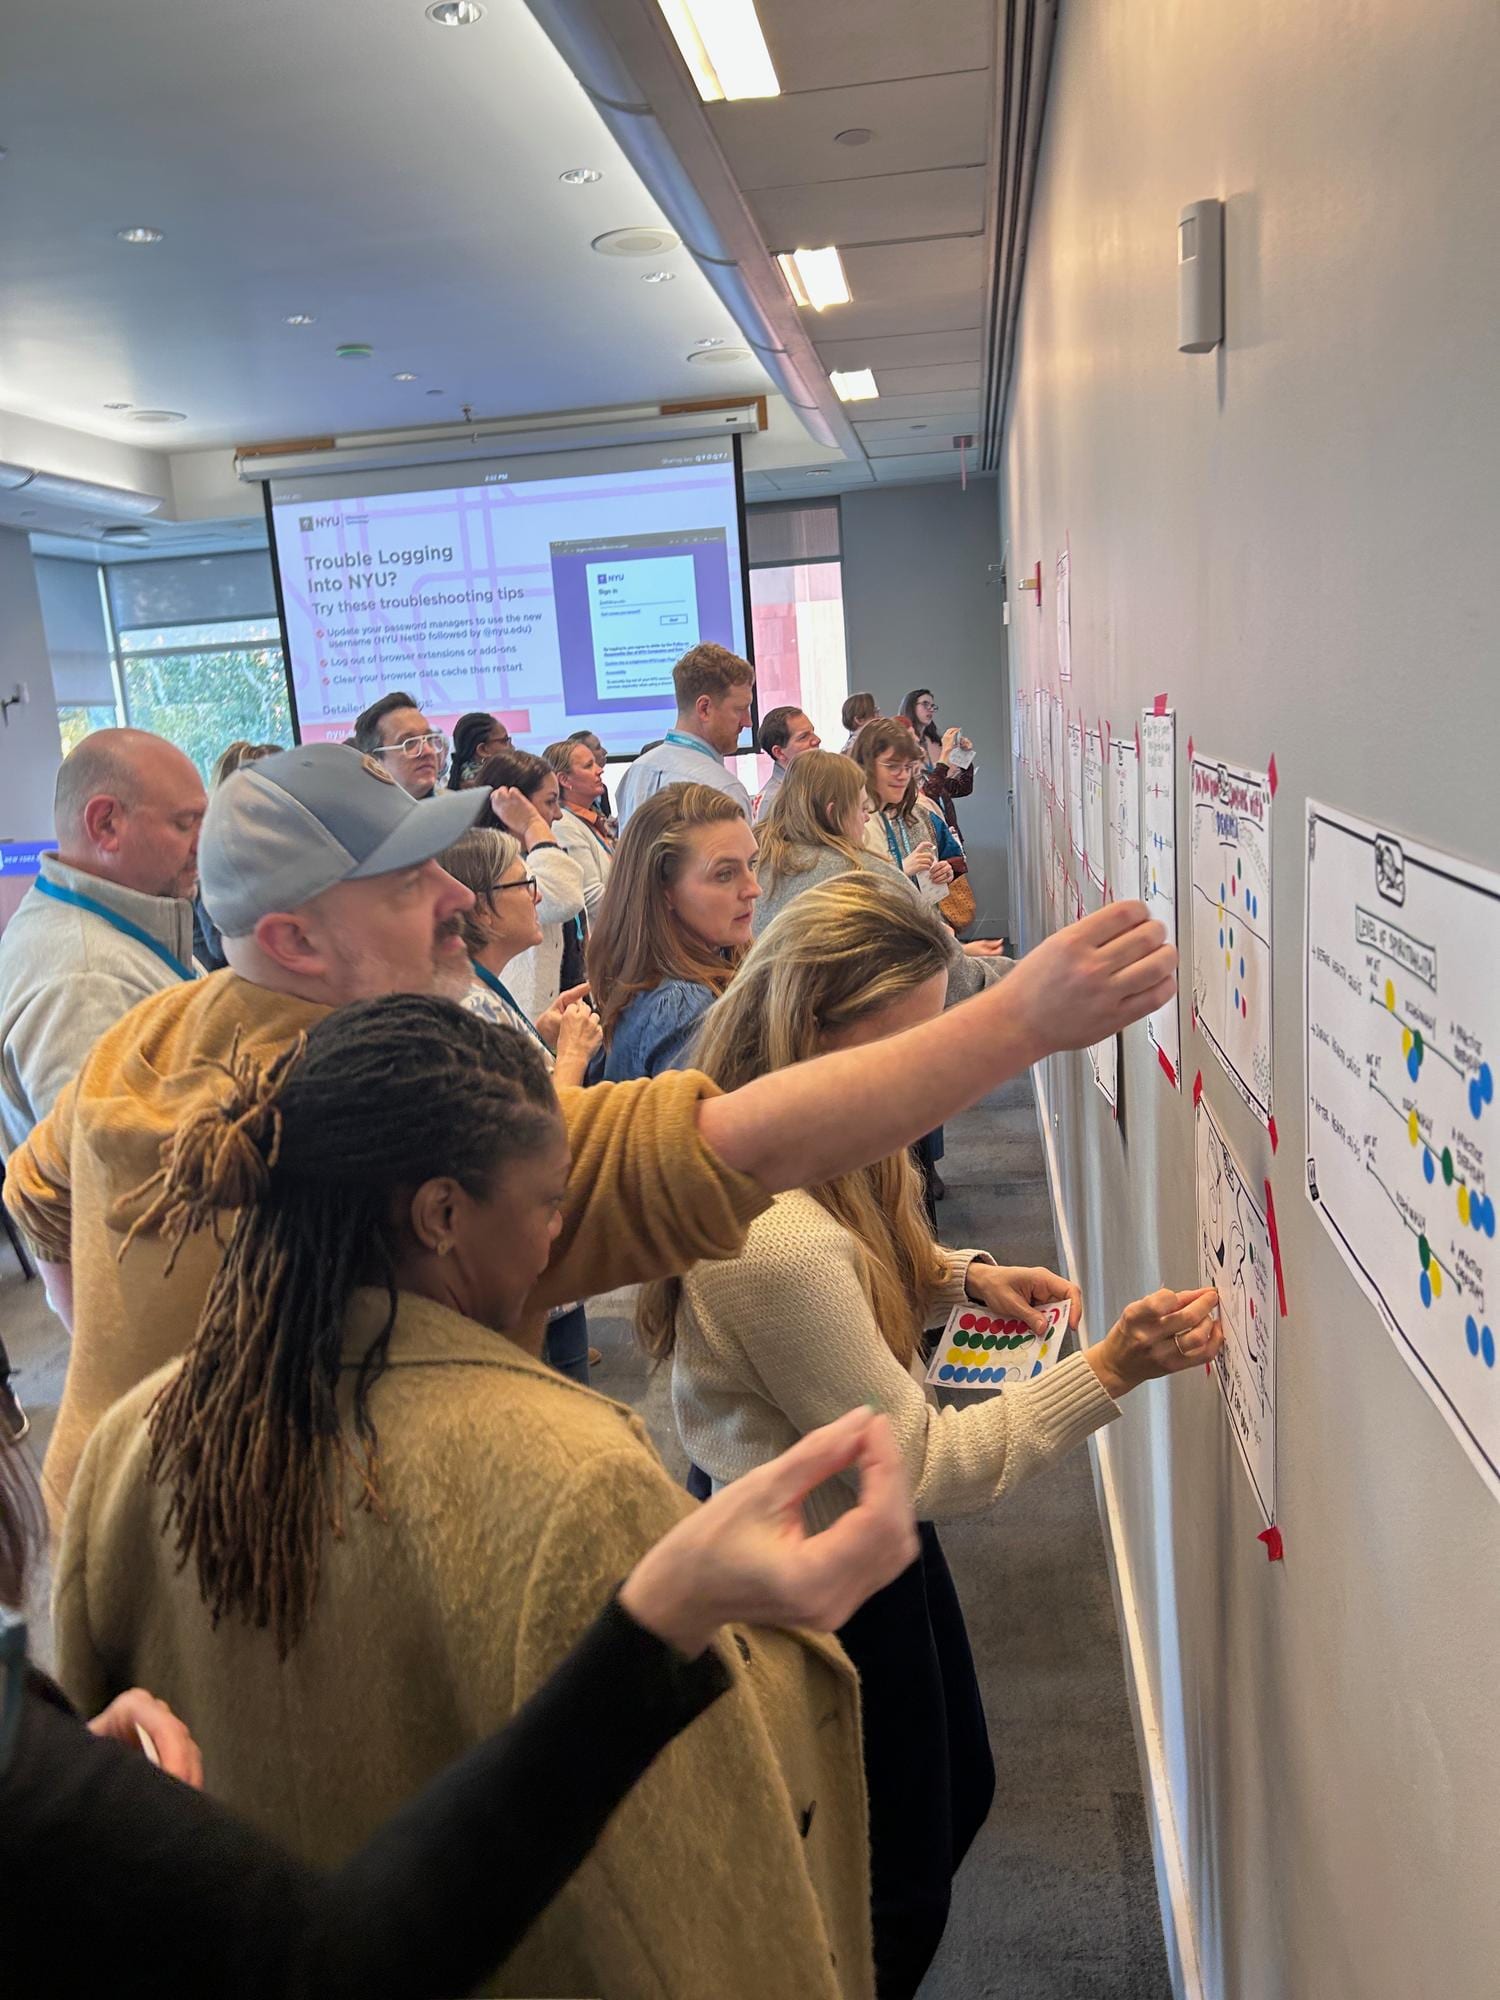
- PastWorkshopNYU, New YorkTalking to the community through data: NOAHCON 2517 NOV 25New York
- PastTalkComplexity Science Hub, ViennaVisualizing Complexity Science: a guest talk in ViennaAUGUST 2025Vienna
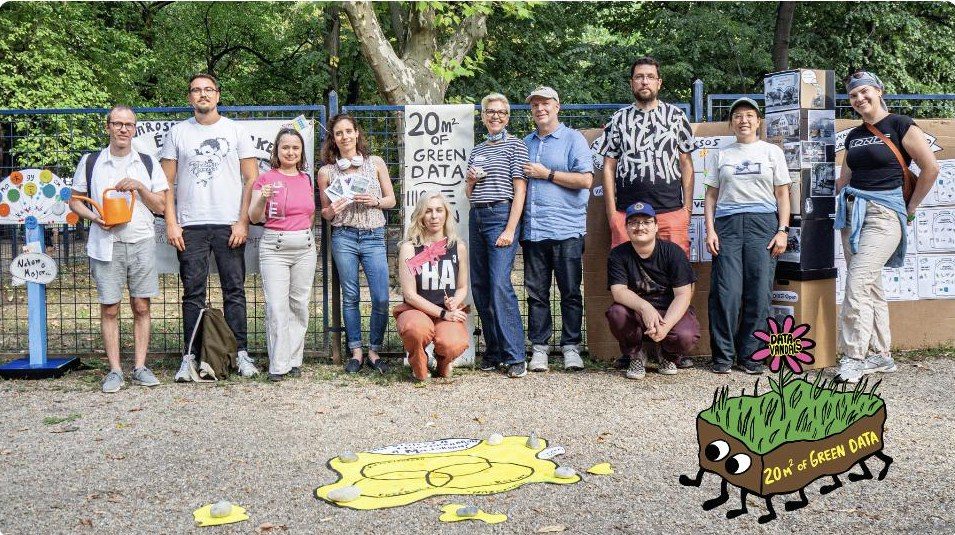
- PastWorkshopMOME, Budapest20 m² of green data: MOME Open, Budapest21-22 AUG 25Budapest
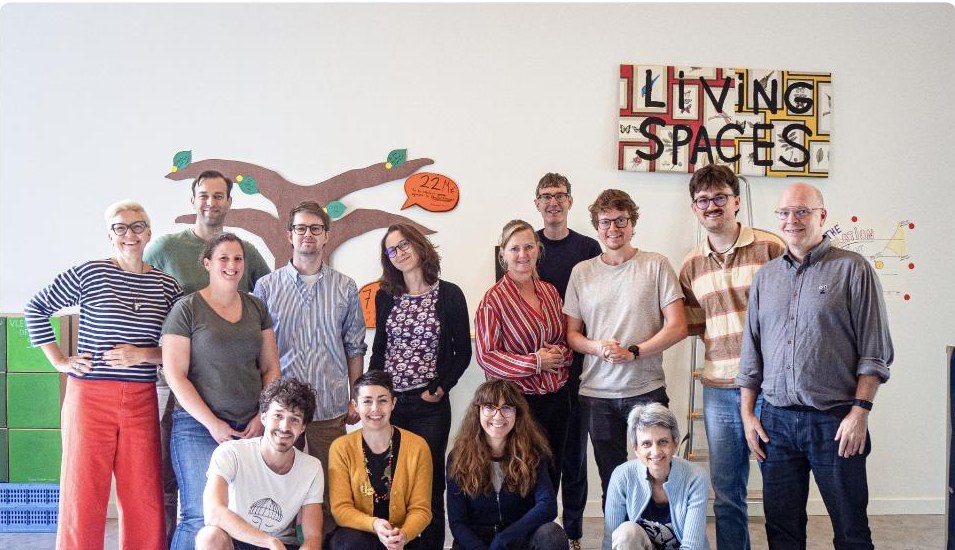
- PastWorkshopCentraal Museum, UtrechtLiving Spaces: an exhibition built from nothing in 48 hours4-5 AUG 25Utrecht
- PastTalkGordon Research ConferenceVisualization for Impact: the Gordon Research Conference at Bates CollegeJULY 2025Lewiston, Maine
- PastWorkshopCanva HQ, LondonData That Moves Us: a Guerrilla Data Lab at Canva HQ10 JUL 25London
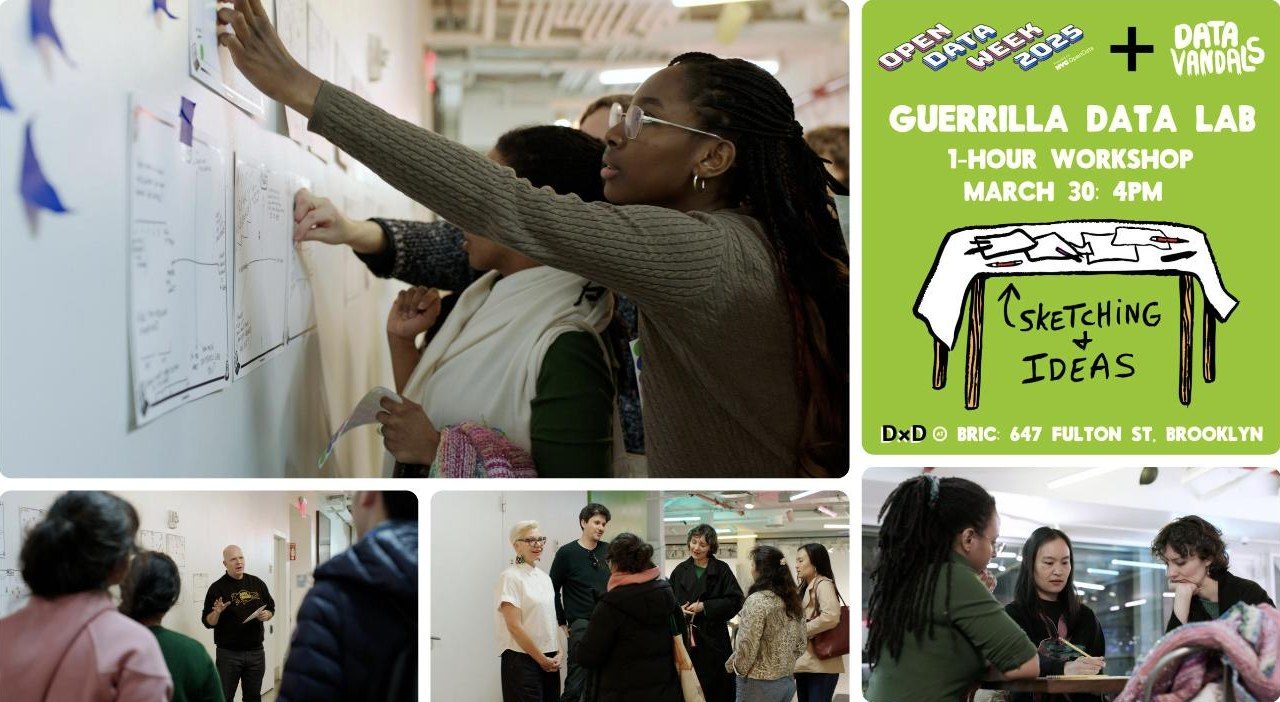
- PastWorkshopBRIC, BrooklynGuerrilla Data Lab: 60 minutes at BRIC for NYC Open Data Week30 MAR 25Brooklyn
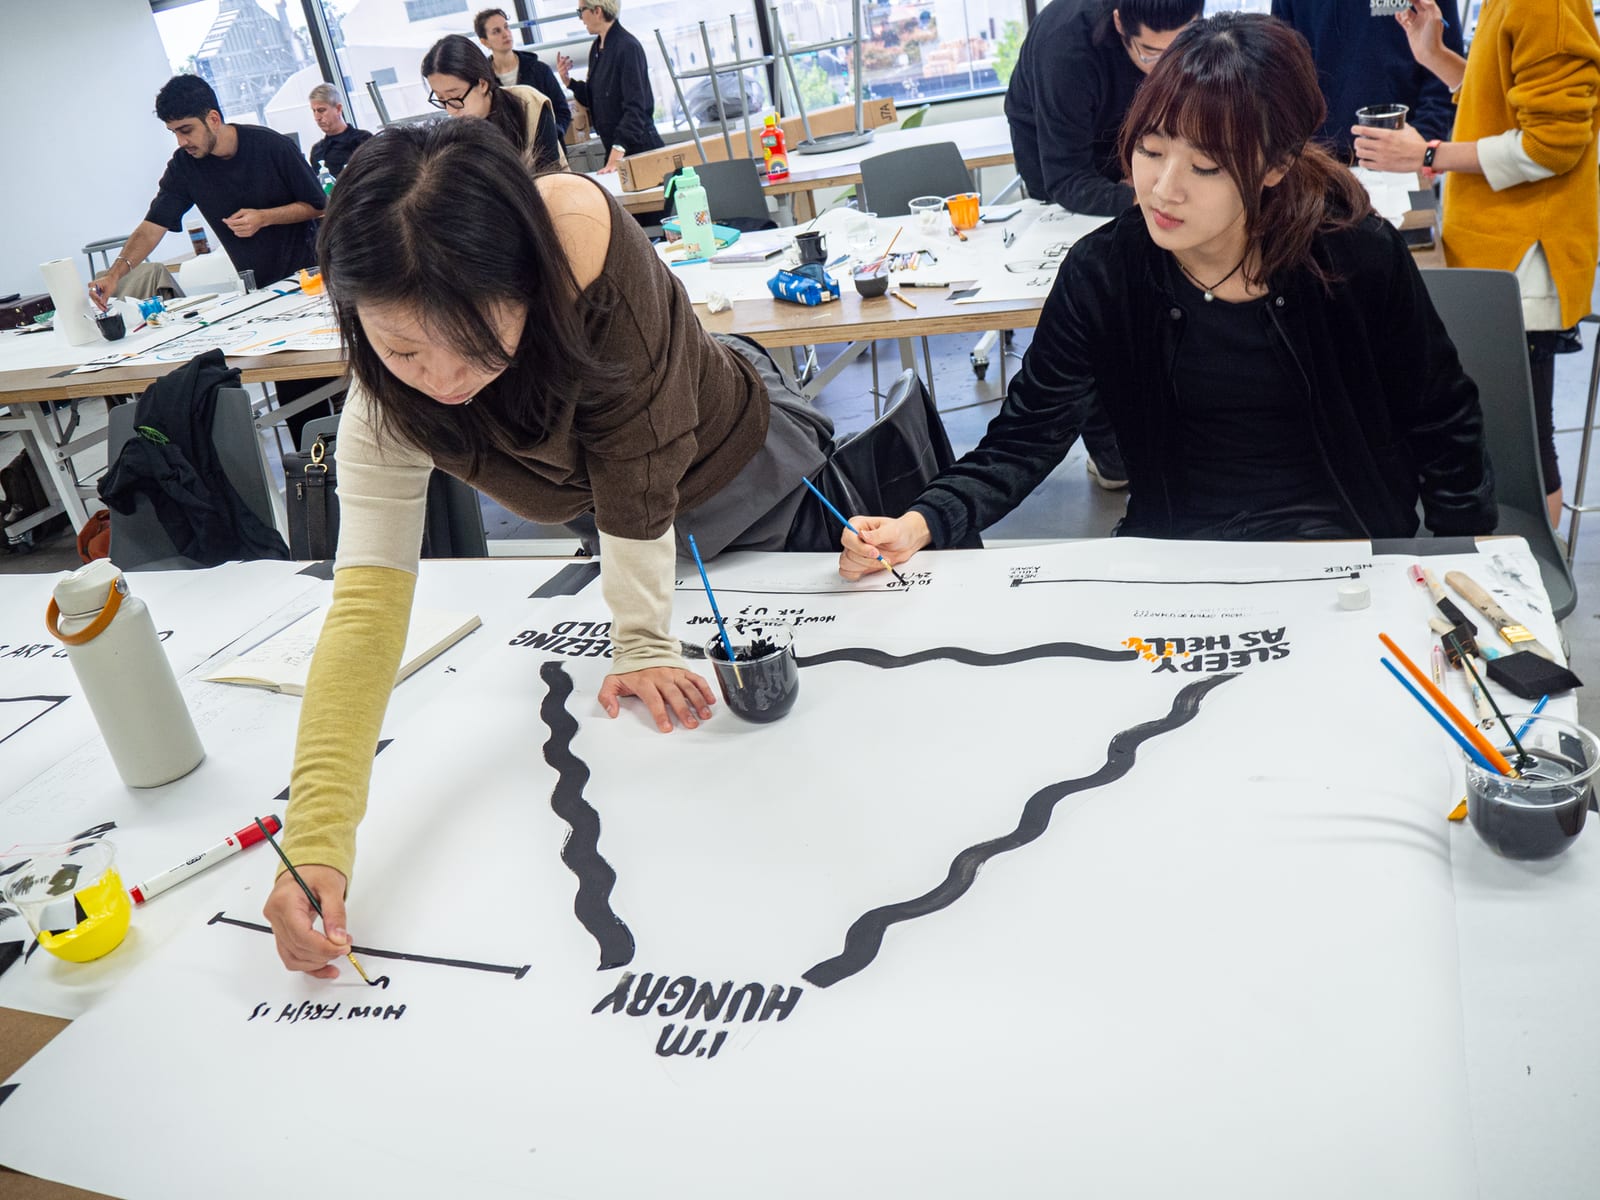
- PastWorkshopArtCenter College of DesignHands-on dataviz workshops at ArtCenter11-14 NOV 24Pasadena
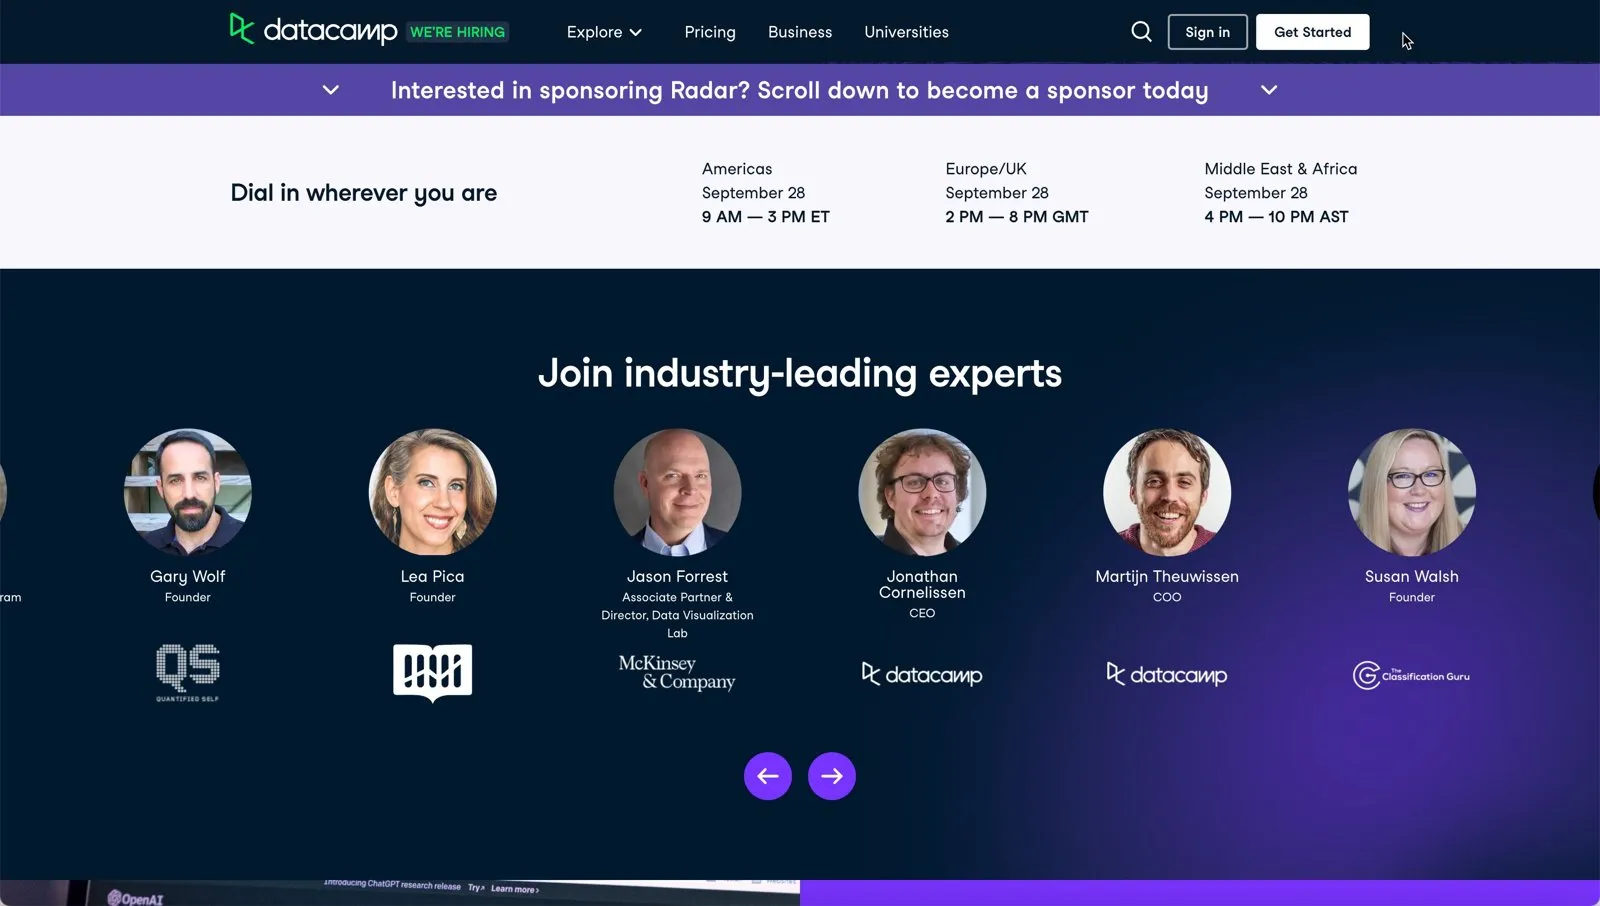
- PastPanelDataCamp RADARData leaders panelSep 2023Online
- PastLectureSymbol ’22Isotype and Graphic Language — watch, 23 minOct 2022Online
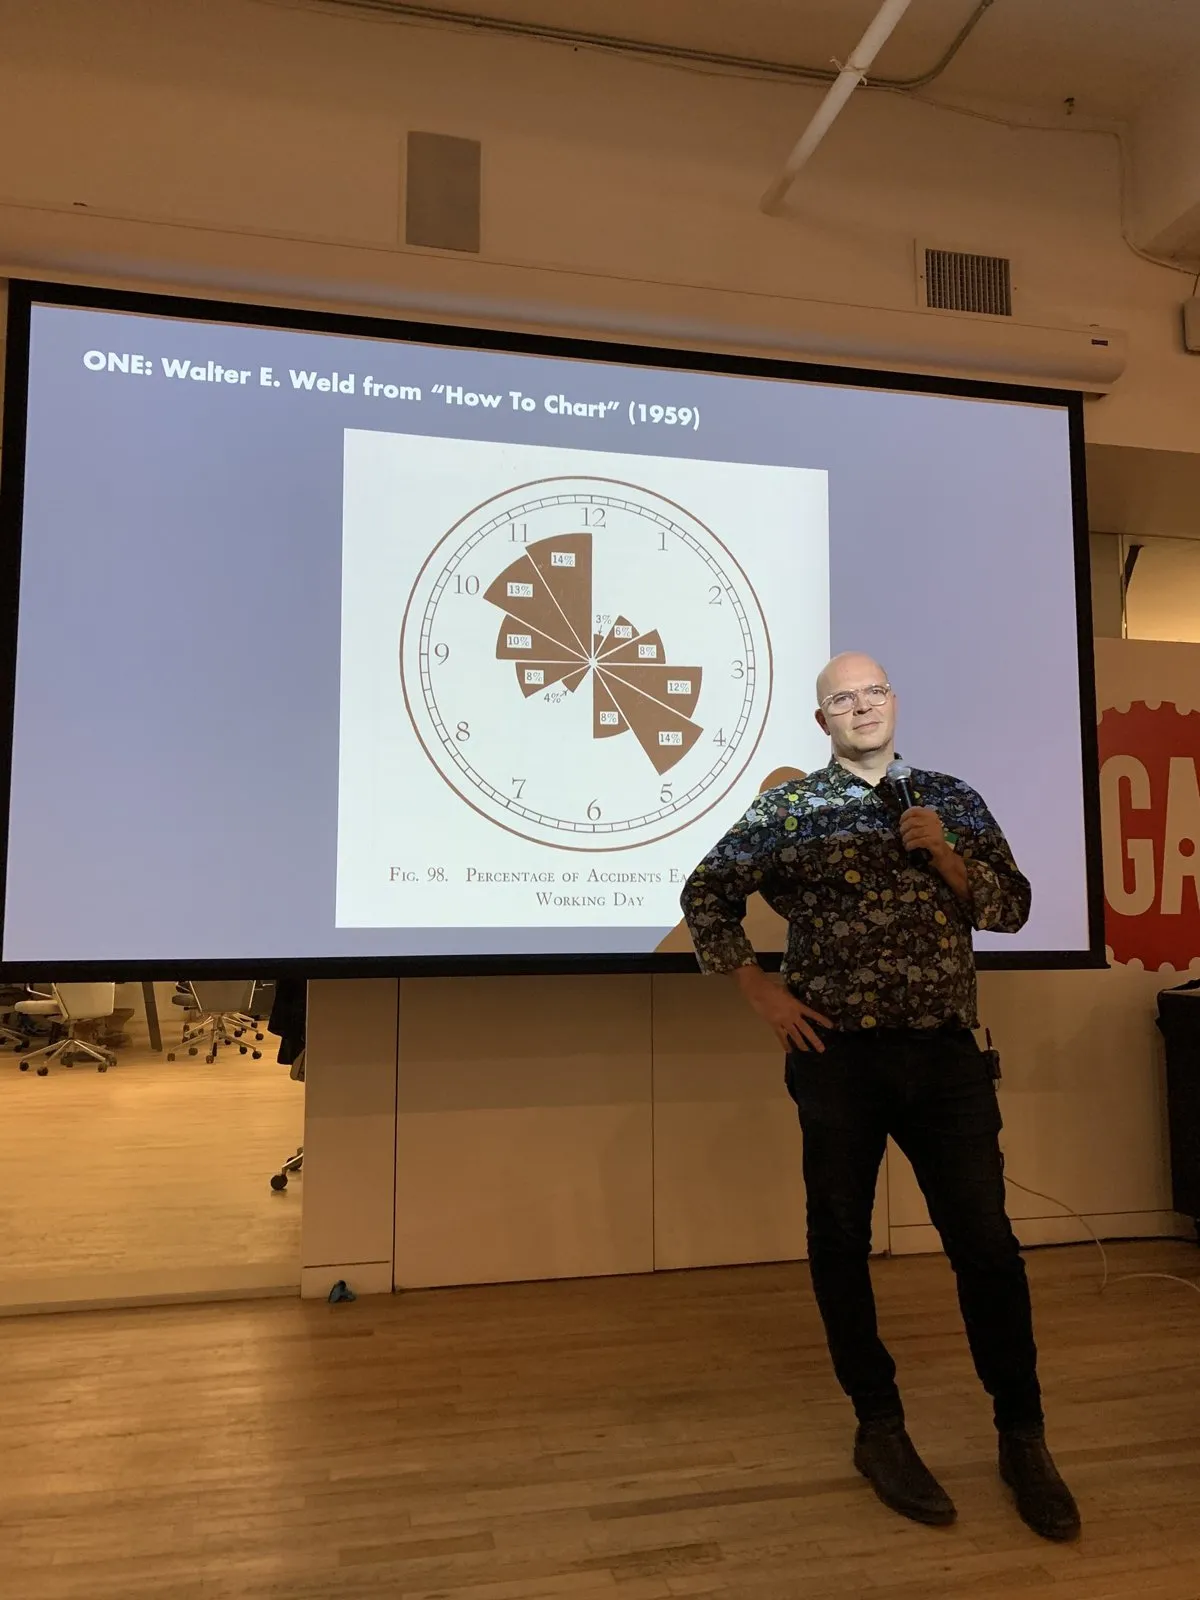
- PastTalkGeneral AssemblyHow to Chart — lessons from Walter E. Weld (1959)New York
- PastLectureUniversity of OxfordW.E.B. Du Bois — Black History Month lecture — listenOct 2020Oxford